Download
1 / 5
50 likes | 111 Views
Explore ecosystem dynamics in South Africa's Cape Floristic Region, focusing on fire frequency, biodiversity, and invasive species. Utilize various data sources like satellite imagery and field measurements to study disturbance and recovery patterns over time. Investigate the impact of factors like vegetation cover, climate, and human activities on the region's ecology. This research aims to develop a conservation model for Fynbos ecosystems.

E N D
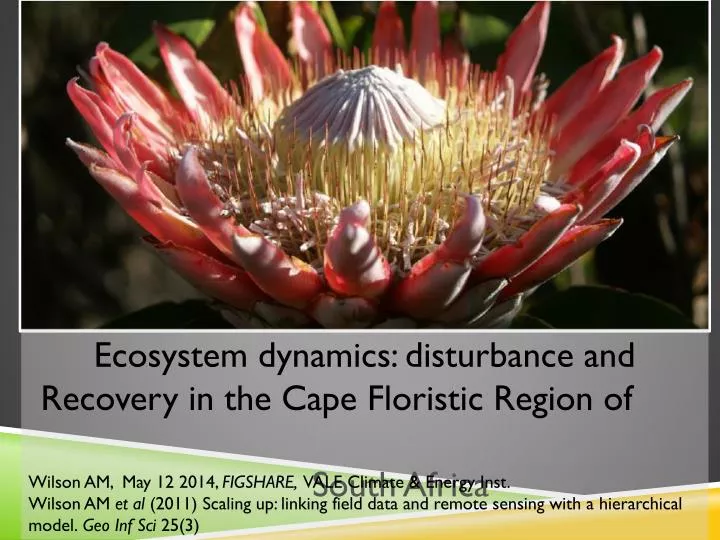
Ecosystem dynamics: disturbance and Recovery in the Cape Floristic Region of South Africa Wilson AM, May 12 2014, FIGSHARE, VALE Climate & Energy Inst. Wilson AM et al (2011) Scaling up: linking field data and remote sensing with a hierarchical model. Geo Inf Sci 25(3)
DATA SOURCES Burned areas from field & satellite ~1980 to present Topography 90m LANDSAT (satellite) Vegetation Index 30m * 1970 to present MODIS (satellite) Vegetation Index 250m* 2000 to present Daily temp and precipitation (gridded) 10km* 1950 to present Biomass measurements 2x3m quadrts0.1-12ha plots, 2009-10 (*resolution spectral bands) Antarctic Ocean Oscillation cycles CLOUD COVER index. Research Q: How does FIRE FREQUENCY vary in space and time?
biodiversity index Inclthe3 major INVASIVE species (Aus. Acaciaand Wattle) maturity index for Fynbos, NOT necessarily related to veg height/density land use index “dispersal corridor”: (lack of) veg cover; arson, decr. link between veg quality/age with fire cause/frequency GROUNDTRUTHING database correlate date, rainfall, fire, topography, species cover (density, diversity, alien spp) visible land markers with LANSAT spectrometry [~~ digital age SAPIA!] Further research Q: Fynbos conservation model (Wilson fire frequency ratio+ biodiversity + maturity + land use index)
Sonoran Desert EPA Level IV Ecoregions - ESRI 2010 MAP Shortwave Infrared & Topographic – ESRI 1989-2010 Ecoregions – SANBI 2005