Download
1 / 12
130 likes | 319 Views
Gaussian Distributions of Signal and Noise with Equal Variances. Chapter3. March 28, 2005. The ROC Curve for the Yes-No Task. ▶ Standard Normal distributions -> means = 0 , S.D. = 1 ▶ 그래프 해석 1) Five Criterion 2) Normal Curve Table -each criterian associated with H and FA

E N D
Gaussian Distributions of Signal and Noise with Equal Variances Chapter3. March 28, 2005
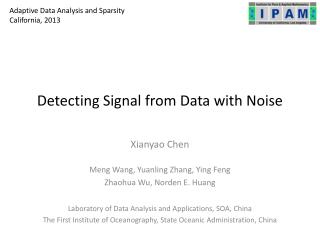
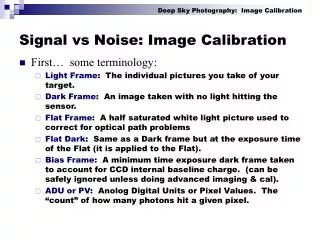
The ROC Curve for the Yes-No Task ▶Standard Normal distributions -> means = 0 , S.D. = 1 ▶그래프 해석 1) Five Criterion 2) Normal Curve Table -each criterian associated with H and FA (기준점을 중심으로 오른쪽 곡선 아래 area) Fig.3.1 Gaussian distributions of signal and noise - mean >> Noise = 0 ; Signal = 1 - variance >> Niose = Signal=1 FA H Z(S|n) Z(S|s)
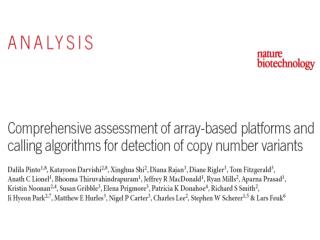
Double-Probability Scales(D.P.S) P(S|n) ▶ROC Curve : P(S|s)와 P(S|n)을 같은 공간에표현 vs ▶D.P.S. : P(S|s)와 P(S|n) 그리고 Z(S|s)와 Z(S|n)을 같은 공간에 표현 1)Why should the double-probability plot be a straight line? 2)Why should the line run parallel to the positive diagonal? D.P.S.나타낼 경우, 곡선아닌 positive diagonal에 수평인 직선이 나타남. Z(S|s) P(S|s) Z(S|n)
Double-Probability Scales(D.P.S) 1)Why should the double-probability plot be a straight line? 2)Why should the line run parallel to the positive diagonal? *Remember! => Z(S|s) & Z(S|n) :equal variance 그러므로, Noise distribution의 X축을 따라 1 S.D. unit를 이동하면 Signal distribution와 겹침. 즉, Z(S|n) 의 x증가는 Z(S|s) 의 x증가내에서의 결과. 따라서 Z(S|s) & Z(S|n) 는 직선적인 연관이 있 고 line slope는 1과 같다.
Double-Probability Scales ▶ d'값을 찾는 것이 가능 for any criterion, Z(S|n) - Z(S|s) -여기서는 항상 Z(S|n) - Z(S|s) = +1임 ▶P(A) = d' ▶ d' Assumption 1) Normal distribution. 2) Same Varience
The Formula for d' Xs – Xn σn Xs - Xn X – μ σ (Xs : signal의 분포 평균 / Xn :Noise의 분포 평균) ▶ d' :평균 사이의 거리 d' = ▶ d' 은 noise 분포의 표준편차 단위에서 측정되므로, 더 정확한 식은 d' = ( z= ) *이것은 표준화된 Z 값과 비슷하게 표현됨.
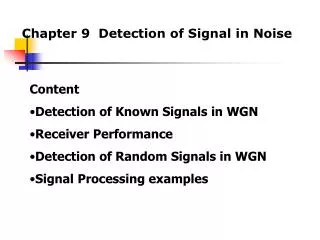
The Criterion P(x|s) P(x|n) ▶ ROC Curve is possible 1) to find distance between the distribution means.(d‘) 2) to find the criterion points the observer used. (β) ▶Fig 1.1, If an observer desides to respond S whenever x>=66 in, and to respond to whenever x<66 in. β=l(x)= =3/4 => P(x|s)와 P(x|n)은 실제 x=66에서 signal 과 noise의 분포의 높이임. X=66
The Criterion -1/2(x-d) 2 e √2 -1/2x 2 e √2 ▶signal distribution height :ys Noise distribution height :yn l(x) =ys/yn ▶높이 구하는 식 yn= x =Z(S|n) , noise분포로 부터 기준거리 = 3.142 e = 2.718 ys = x -d=Z(S|s) , signal분포로 부터 기준거리 ys yn
The Criterion ▶ β properties.. 1) Criterion c, β=1(ys=yn) 2) β<1 , Bias to signal (모험적) 3) β>1 , Bias to noise (보수적) ▶ Bias to signal, 0< β<1 Bias to noise, β>1 => 범위가 다르다. log 사용
The Criterion -1/2(x-d) -1/2(x-d) 2 2 e e -1/2x -1/2x 2 2 e e -1/2(x-d) 2 e √2 -1/2x 2 e √2 ▶β =l(x) =ys/yn= 정리하면, β= ln e = x를 β적용하면, ln β= ln = ln e ln β= x 1/2d(2nx-d) 1/2d(2nx-d)
Chap.3Gaussian Distributions of Signal and Noise with Equal Variances