Download
1 / 38
390 likes | 668 Views
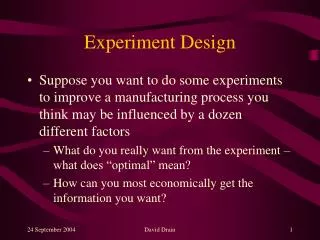
Planning for a Successful Design of Experiment. Jim Akers SIU ASQ Spring Conference 2013. Topics we will cover. This presentation will provide a process for planning a successful design of experiment. We will cover the basics of DOE creating a charter

E N D
Planning for a Successful Design of Experiment Jim Akers SIU ASQ Spring Conference 2013
Topics we will cover This presentation will provide a process for planning a successful design of experiment. We will cover • the basics of DOE • creating a charter • choosing an appropriate design The participants will take away a DOE charter template and a flowchart for simple design selection. The major focus is asking and answering the right questions to create an appropriate experiment.
Objectives in Using DOE • Will help you gain knowledge in: • Improving performance characteristics • Understand relationships between process variables • Reducing costs • Understand how to optimize processes • Creates the ultimate process knowledge to make your product/process Better Faster Cheaper
Let’s Start with an Example: Plot a histogram and calculate the average and standard deviation Fuel Economy 16 14 12 10 Number of Cars 8 6 4 2 0 0 to <6 6 to <12 12 to <18 18 to <24 24 to <30 30 to <36 36 to <42 42 to <48 48 to <54 54 to <=60 mgp
MANPOWER METHOD MACHINE Effect EFFECT MEASUREMENT MATERIAL What Might Explain the Variation? • DOE is about discovering and quantifying the magnitude of cause and effect relationships. • We need DOE because intuition can be misleading.... but we’ll get to that in a minute. • Regression can be used to explain how we can model data experimentally. MOTHERNATURE
Mileage Data with Vehicle Weight: • Let’s take a look at the mileage data and see if there’s a factor that might explain some of the variation. • Draw a scatter diagram for the following data: X Y Y=f(X)
Regression Analysis • Plot the data on a scatter chart and draw a best fit line • Determine the equation for that line, • you now have a ‘model’ for the data Y=f(X) We have now experimented with one factor, but that does not explain all of the variation. ~21 2800
Experimenting with a System There are a few basic ways to understand a process you are working on. We will talk about two of them. • Classical 1FAT experiments • One factor at a time (1FAT) focuses on one variable at two or three levels and attempts to hold everything else constant (which is impossible to do in a complicated process). • DOE • When properly constructed, it can focus on a wide range of key input factors and will determine the optimum levels of each of the factors. Each have their advantages and disadvantages.
1FAT Example • Let’s consider how two known (based on years of experience) factors affect gas mileage, tire size (T) and fuel type (F). T(1,2) Y Y=f(X) F(1,2)
1FAT Design Step 1: Select two levels of tire size and two kinds of fuels. Step 2: Holding fuel type constant (and everything else), test the car at both tire sizes.
1FAT Design Since we want to maximize mpg the more desirable response happened with T2 Step 3: Holding tire size at T2, test the car at both fuel types.
1FAT Design • Looks like the ideal setting is F2 and T2 at 40mpg. • This is a common experimental method. What about the possible interaction effect of tire size and fuel type? F2T1
1FAT Design • Suppose that the untested combination F2T1 would produce the results below. • There is a different slope so there appears to be an interaction. A more appropriate design would be to test all four combinations. • That is called a full factorial
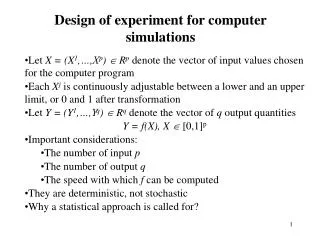
What About Other Factors – and Noise? • We need a way to • investigate the relationship(s) between variables • distinguish the effects of variables from each other (and maybe tell if they interact with each other) • quantify the effects... ...So we can predict, control, and optimize processes.
DOE to the Rescue!! Y=f(X) DOE uses purposeful changes of the inputs (factors) in order to observe corresponding changes to the outputs (response). Remember the IPO’s we did – they are real important here.
(-,+) (+,+) High (+) In tabular form, it would look like: Factor B Settings Low (-) Run A B (-,-) (+,-) 1 - - 2 - + 3 + - Low (-) High (+) 4 + + Factor A Settings The Basics • To ‘design’ an experiment, means to pick the points that you’ll use to understand the design space. X1 A Y X2 B Design Space AB + - - +
Full vs. Fractional Factorial • A full factorial is an experimental design which contains all levels of all factors. No possible treatments are omitted. • The preferred (ultimate) design • Best for modeling (Response Surface Methods) • A fractional factorial is a balanced experimental design which contains fewer than all combinations of all levels of all factors. • The preferred design when a full factorial cannot be performed due to lack of resources • Okay for some modeling • Good for screening
2 Level Designs • Full factorial • 2 level • 3 factors • 8 runs • Balanced (orthogonal) • Fractional factorial • 2 level • 3 factors • 4 runs - half fraction • Balanced (orthogonal)
3 Level Designs • Full factorial • 3 level • 3 factors • 27 runs • Balanced (orthogonal) • Used when it is expected the response is non-linear
Average Y when A was set ‘high’ Average Y when A was set ‘low’ Measuring An “Effect” • The difference in the average Y when A was ‘high’ from the average Y when A was ‘low’ is the ‘factor effect’ • The differences are calculated for every factor in the experiment
Looking For Interactions When the effect of one factor changes due to the effect of another factor, the two factors are said to ‘interact.’ B = Low B = High B = Low Response - Y Response - Y Strong B = High Slight Low High Factor A Low High Factor A more than two factors can interact at the same time, but it is rare outside of chemical reactions. None B = Low Response - Y B = High Low High Factor A
Reasons Why a Model Might Not Confirm: • Too much variation in the response • Measurement error • Poor experimental discipline • Aliases (confounded) effects • Inadequate model • Something changed - And: - There may not be a true cause-and-effect relationship.
Proof – Storks do bring babies! • A plot of the population of Oldenburg, Germany at the end of each year against the number of storks observed in that year, 1930-1936. Source: “Statistics for Experimenters” by Box, Hunter, and Hunter. (1978)
Response Surface Method - 2D Contour Plot • Useful to see how factors effect the response and to determine what other settings provide the same response
Response Surface Method- 3D Response Surface Plot • Helpful in reaching the optimal result
Planning - DOE Steps • Set objectives - create a Charter • Comparative • Determine what factor is significant • Screening • Determine what factors will be studied • Model – Response Surface Method • Determine interactions and optimize • Select factors (process variables from C&E) and levels you will test • Select an experimental design • Execute the experiment • CONFIRM the model!! Verify the data is consistent with the experimental assumptions • Analyze and interpret the results • Use/present the results
Planning - Charter • I. STATEMENT OF THE PROBLEM: ____________________________________________________________________________________ (During this step you should estimate your current level of quality by way of Cpk, dpm, or total loss. This estimate will then be compared with improvements found after Step XII.) • II. OBJECTIVE OF THE EXPERIMENT: ____________________________________________________________________________________ • III. START DATE: ________END DATE: ________
Planning - Charter • IV. SELECT MEASUREABLE QUALITY CHARACTERISTICS (also known as responses, dependent variables, or output variables). These characteristics should be related to customer needs and expectations.
Planning - Charter • V. COMPLETE A LITERATURE REVIEW, PROCESS FLOW DIAGRAM, AND CAUSE & EFFECT DIAGRAM. FROM THE CAUSE & EFFECT DIAGRAM SELECT FACTORS (also known as parameters or input variables) which are anticipated to have an effect on the response. Write Standard Operating Procedures for all variables that are to be held constant.
Planning - Charter • VI. DETERMINE THE NUMBER OF RESOURCES TO BE USED IN THE EXPERIMENT. Consider the desired number, the cost per resource, time per experimental trial, the maximum allowable number of resources. • VII. WHICH DESIGN TYPES AND ANALYSIS STRATEGIES ARE APPROPRIATE? Discuss advantages and disadvantages of each. • VIII. SELECT THE BEST DESIGN TYPE AND ANALYSIS STRATEGY TO SUIT YOUR NEEDS.
Planning - Charter • IX. CAN ALL THE RUNS BE RANDOMIZED? ____________________________________________________________________________________ WHICH FACTORS ARE MOST DIFFICULT TO RANDOMIZE?________________________________________________________________________ • X. CONDUCT THE EXPERIMENT AND RECORD THE DATA. (Monitor both of these events for accuracy.) • XI. ANALYZE THE DATA, DRAW CONCLUSIONS, MAKE PREDICTIONS, AND PERFORM CONFIRMATION TESTS.
Planning - Charter • XII. ASSESS RESULTS, MAKE DECISIONS, AND DOCUMENT YOUR RESULTS. (Evaluate your new state of quality and compare with the quality level prior to the improvement effort. Estimate your return on investment. If necessary, conduct more experimentation.) MS Word Template available at: http://jimakers.com/downloads/DOE_Setup.docx
Choosing an Appropriate Design Source: Understanding Industrial Designed Experiments – ISBN 1-880156-03-2
2-Level Design Summary Source: Understanding Industrial Designed Experiments – ISBN 1-880156-03-2
Thank you Jim Akers