Download
1 / 4

E N D
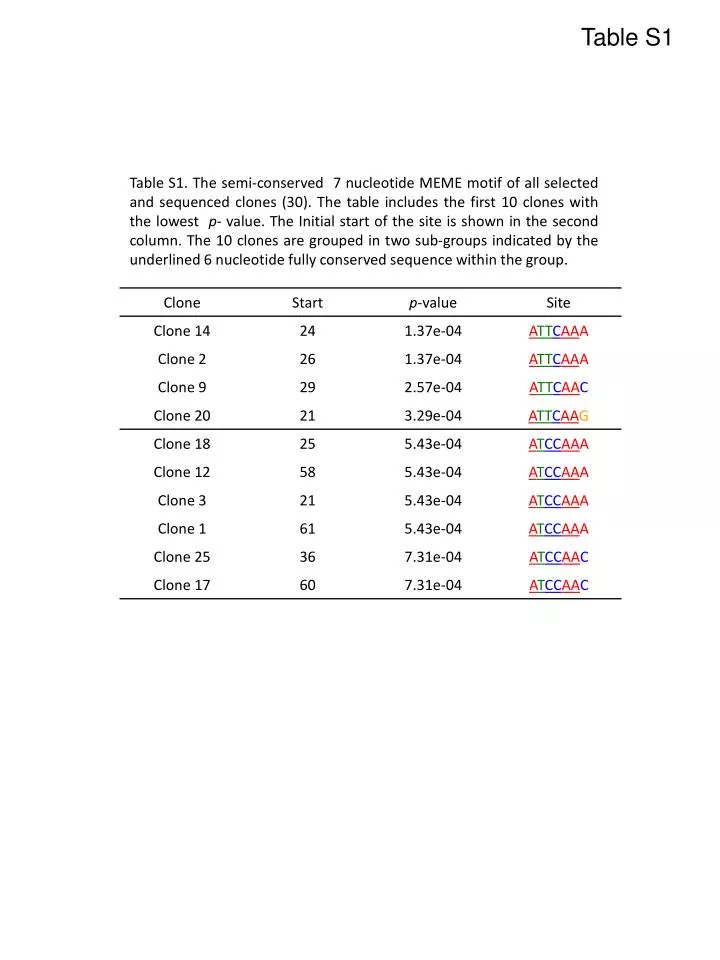
Table S1 Table S1. The semi-conserved 7 nucleotide MEME motifof all selected and sequencedclones (30). The table includes the first 10 cloneswith the lowestp- value. The Initial start of the site is shown in the second column. The 10 clonesaregrouped in twosub-groupsindicated by the underlined 6 nucleotidefullyconservedsequencewithin the group.
Table S2 Table S2. Rate constants calculated from Biacoresensograms of 400 nMRNA aptamers on amine coupled Protein E. 400 nMof each aptamer was injected at 10 µl/min on a Biacore CM5 chip with amine coupled Protein E (~1800 RU). The rate constants kobs and koffare the initial fast rates from a two-phase non-linear regression of 800 s of association and 800 s of dissociation. KD is calculated as koff/kon. For the rate constants shown in the table the R-value of the two-phase non-linear regression is shown below the rate value. The kofffor clone 1 and clone 23 that are underlined represents values with an R-value lower than 0.99 and no values could be obtained for clone 4 and the negative control d12.
Figure S1 Figure S1. Thisfigure shows a 43 nucleotide long motifisolated from a MEME run on all 30 randomregions from the sequencedclones. The MEME motifanalysiswasrunwith no limitations on lenght. The presented motifwasfound in 11 clones.
Figure S2 ―Clone 1 ―Clone 2 ―Clone 3 ― Clone 4 ― Clone 7 ― Clone 9 ― Clone 15 ― d12 Response (RU) Time (s) Figure S2. Binding of RNA aptamer on amine coupled PE in a Biacore. 400 nM of each aptamer was injected at 10 µl/min on a CM5 chip with amine-coupled PE (~1800 RU) on a Biacore 3000. The injection phase was 900 s and the dissociation phase was more than 1000 s. Data are Y-normalizedusing the Biaevaluation software.