Download
1 / 4
40 likes | 146 Views
Supplemental Table S1. Table S1. Quantitative real-time RT-PCR primer sequences for genes used in the publication. All sequences are listed in the 5’ – 3’ direction. Supplemental Fig. S1. Induced by E2 and IGF-I. 3hr. 24hr. Repressed by E2 and IGF-I. 3hr. 24hr.

E N D
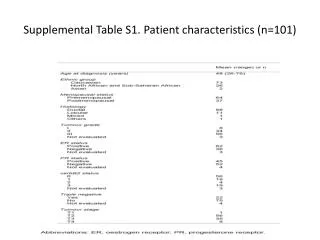
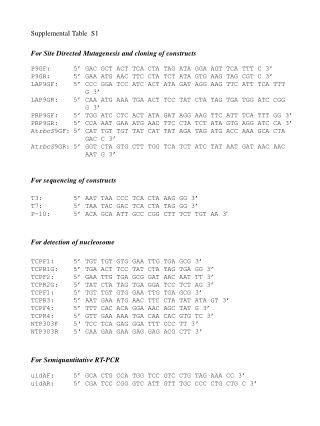
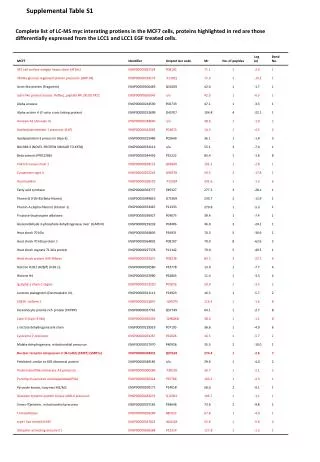
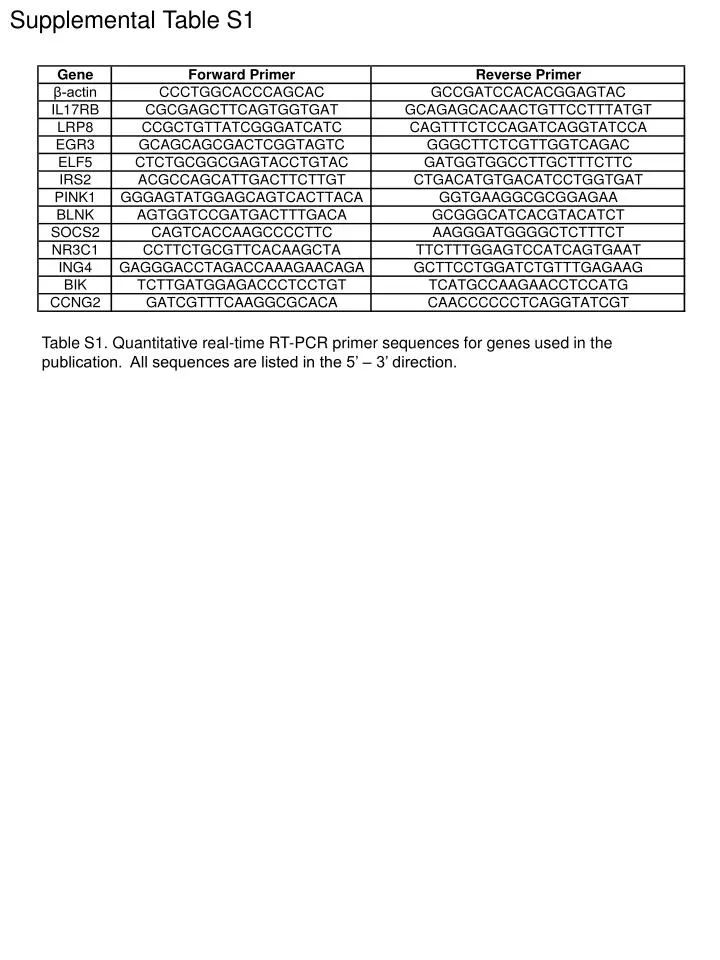
Supplemental Table S1 Table S1. Quantitative real-time RT-PCR primer sequences for genes used in the publication. All sequences are listed in the 5’ – 3’ direction.
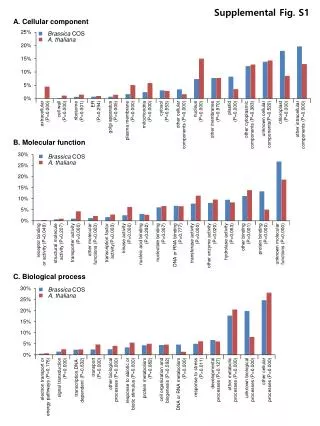
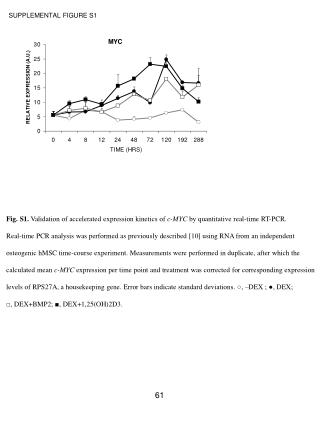
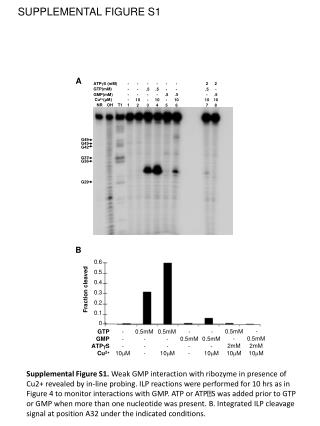
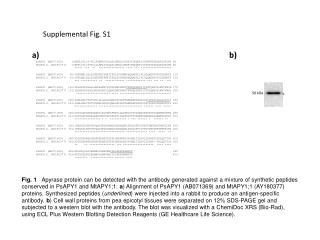
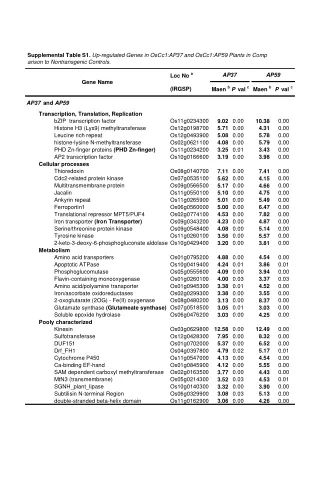
Supplemental Fig. S1 Induced by E2 and IGF-I 3hr 24hr Repressed by E2 and IGF-I 3hr 24hr FIG. S1. Gene ontology (GO) terms associated with genes found to be induced or repressed by both E2 and IGF-I. MCF-7 cells were treated with E2 (10nM) or IGF-I (50ng/mL) for 3hr or 24hr. Samples were then processed for microarray analysis. Genes found to be induced by both E2 and IGF-I or repressed by both ligands were subjected to GO analysis and representative terms are shown in the tables.
Supplemental Fig. S2 Deactivated Intermediate Activated Log Rank P=1.7E-6 FIG. S2. Removal of “cell cycle” associated genes does not change the fact that an activated E2/IGF-I co-regulated gene signature in clinical breast tumors is associated with poor prognosis. Kaplan-Meier analysis of the van de Vijver tumor profile data set comparing the differences in risk among three groups of patients when only tumors classified as ERα-positive were considered. Genes that were either annotated as “cell cycle” by gene ontology analysis or were experimentally found to be correlated with cell cycle progression were omitted from the analysis. Green line, tumors having an “activated” co-regulated gene signature (i.e. significant correlation, p<0.01, to the pattern of up- and down-regulation by E2 and IGF-I observed in vitro); pink line, “deactivated” tumors that have low similarity (i.e. anti-correlation, p<0.01) to the E2/IGF-I pattern; and yellow line, tumors that were neither similar nor dissimilar to the co-regulated gene expression pattern (p>0.01). The log-rank test evaluated whether there are significant differences among any of the three groups.
Supplemental Fig. S3 Fold Change (relative to SFM) Fold Change (relative to SFM) Sorted by E2 Sorted by E2 Sorted by IGF Fold Change (relative to SFM) Sorted by IGF 3hr 24hr Fold Change (relative to SFM) FIG. S3. Several genes found to be repressed by both E2 and IGF-I have been previously described as potential tumor suppressors. These graphs represent the top 20% of genes identified by microarray analysis to fit into the following categories: repressed by both E2 and IGF-I at 3hr and repressed by both ligands at 24hr. Each list is sorted either by E2-fold change or IGF-I-fold change.