Download
1 / 13
130 likes | 138 Views
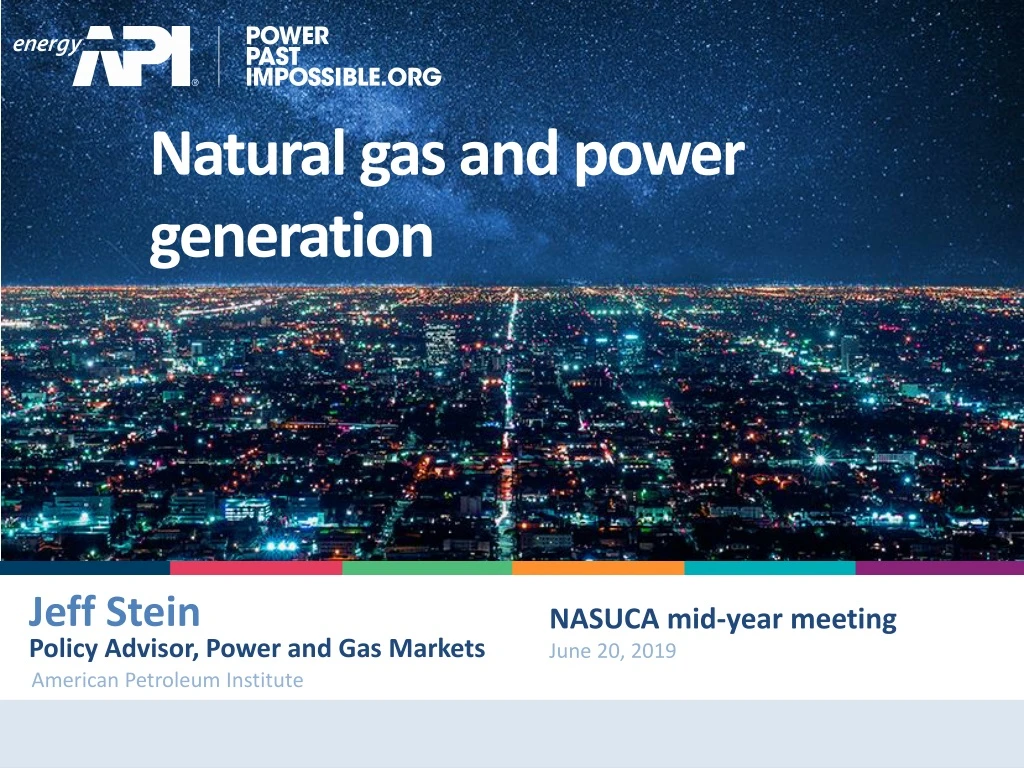
This presentation by Jeff Stein, Policy Advisor at the American Petroleum Institute, highlights the growing supply potential of natural gas, the reduction in price volatility, and the increasing share of natural gas in electricity generation in the United States. The presentation also provides data on North America's technically recoverable resources and the efficiency of natural gas drilling.

E N D
Natural gas and power generation Jeff Stein NASUCA mid-year meeting June 20, 2019 Policy Advisor, Power and Gas Markets American Petroleum Institute
Key messages • The supply potential of natural gas continues to grow – more than 150 years worth of technically recoverable North American resources. • Contrary to the representations of some, natural gas prices have fallen and price volatility was cut in half by the U.S. energy revolution. • Natural gas’ share in the United States’ electricity generation increased to 35% in 2018 from 24% in 2010.
North America’s technically recoverable resources have continued to increase as technology has improved 2016 oil and gas resources recoverable with current technology 19.6 Billion Bbl 147.1 Tcf 2016 Resources/Production Ratio Oil Natural gas 66 years 153 years AK OCS 27.3 Billion Bbl 131.6 Tcf 171.4 Billion Bbl 864 to 1,773 Tcf 2010 Resources/Production Ratio Oil Natural gas 48 years 108 years Atlantic 1,064.8 Tcf U.S. Lower 48 275.8 Billion Bbl 2,817 Tcf Atlantic OCS 4.6 Billion Bbl 38.2 Tcf Pacific OCS 10.2 Billion Bbl 16.1 Tcf GOM OCS 48.5 Billion Bbl 141.8 Tcf 32.1 Billion Bbl 628.2 Tcf • sources: USGS,BOEM, PGC, NRCAN, EIA
Increases in natural gas production U.S. Natural Gas Marketed Production Source: EIA, Natural Gas Monthly Data, February 2018
Drilling specifically for natural gas has become increasingly predominant and cost-effective in the U.S. • With strong productivity gains, the burden to keep the energy renaissance going shifts to the market potential for natural gas demand U.S. gas production by play type Breakeven prices for selected gas plays* $/MMBtu Billion cubic feet per day (Bcf/d) Henry Hub spot price (May 2019) • source: EIA Drilling Productivity Report • *Half cycle breakevens assuming 10% discount factor and play-specific costs source: BTU Analytics (June 2019)
The oil and natural gas industry has produced more natural gas, at a lower price, than EIA’s Annual Energy Outlook Projections AEO 2019 Reference 9
The U.S. energy revolution significantly reduced natural gas price volatility • Although natural gas prices are highly seasonal, price volatility* from 2010 to 2018 fell by half relative to that of the period from 1997 to 2009. Daily Henry Hub Natural Gas Spot Prices Dollars per million Btu
Where enabled by pipeline connectivity, the U.S. energy revolution has generally lowered prices In 2010, before the energy revolution, prices at most natural gas hubs were greater than those at Henry Hub, Louisiana As Pennsylvania and Ohio became major gas producers, prices fell across the eastern U.S. except in New England, which largely failed to expand its pipeline infrastructure Natural Gas Spot Price Differences from Henry Hub (annual averages) A higher premium due to a lack of infrastructure Dollars per million Btu source: Bloomberg
Brattle study: Diversity of reliability attributes – a key component of the modern grid
Questions? Jeff Stein Policy Advisor, Market Development (202) 682-8256 office steinj@api.org