Download
1 / 5
50 likes | 184 Views
Customer Service 2005 - Experiences of Statistics Finland. 3rd Nordic Marketing Conference 14th June 2005, Helsinki Jaana Andelin. Statistics Finland’s goals as the basis of the survey.

E N D
Customer Service 2005 - Experiences of Statistics Finland 3rd Nordic Marketing Conference14th June 2005, Helsinki Jaana Andelin
Statistics Finland’s goals as the basis of the survey • To develop the survey to correspond to Statistics Finland’s customer relationship management strategy and find out how we have succeeded in producing value for customers amongst different customer groups • To measure customer satisfaction and the strength of customer relationship and to follow their development • To produce information in a systematic and measured way about how customers assess • Statistics Finland as a co-operation partner and provider of services in its field • Statistics Finland’s products and services • To identify improvement and development targets and strong areas for Statistics Finland’s activity from the customer viewpoint • To prepare reporting so that the results could be utilised as easily as possible for developing the activity on the organisation’s different levels Jaana Andelin
Implementation of the survey • Random sample of 1,031 contact persons from CRM-system Applix. • Information by email from SF to all respondents beforehand (6.4.2005) • Invitation by email from the research partner, Add Value Ltd. This email included an individual link to get to web questionnaire. (12.4.2005) • Data collection was implemented via Internet in two weeks (12.4. – 26.4.2005.) • Respondents who had not answered were reminded two times (18.4, 22.4.2005) • 46,1 % replied • Presentation of the report to SF’s directors and whole personnel (23.-24.5.2005) • Presentations and discussions both in customer segment teams and in divisions of SF (3.6.2005--) • Main challenges 1.6.2005 - 1.6.2007 are to communicate and benefit the results in SF Jaana Andelin
L Jaana Andelin
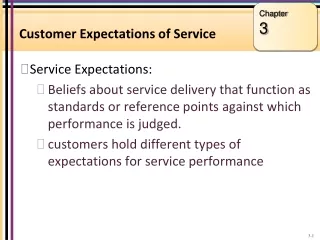
Results and findings • Strengths to be maintained • Development areas • Improvements and impairments (compared with 2003) • Main results according to background groups • Ability to meet customer benefit expectations, strengths and development areas by segment • Changes in results by background group • Segment-specific results proved to be especially valuable • Further clarification and comments from open questionsThe overall estimate of 3.50 for Statistics Finlandas a provider of information services, on a scale 1 -5, is quite good! Jaana Andelin