Download
1 / 12
120 likes | 263 Views
Customization of a Mesoscale Numerical Weather Prediction System for Energy & Utility Applications Anthony P. Praino and Lloyd A. Treinish Deep Computing Institute IBM Thomas J. Watson Research Center Yorktown Heights, NY, USA {lloydt, apraino}@us.ibm.com

E N D
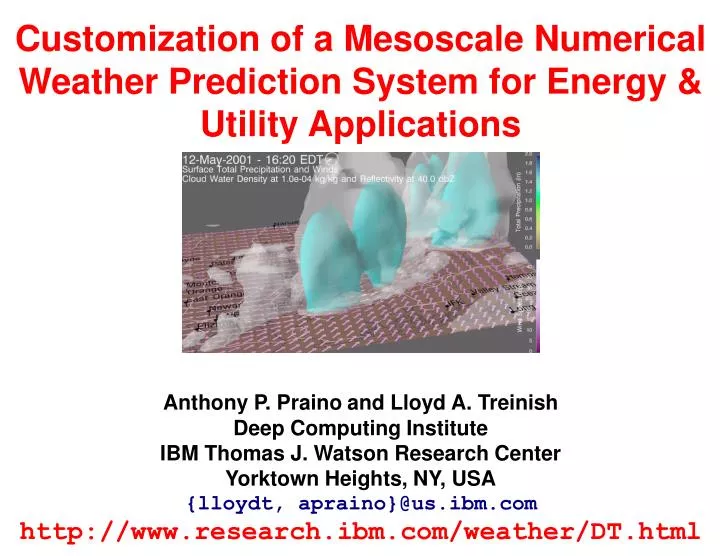
Customization of a Mesoscale Numerical Weather Prediction System for Energy & Utility Applications Anthony P. Prainoand Lloyd A. Treinish Deep Computing Institute IBM Thomas J. Watson Research Center Yorktown Heights, NY, USA {lloydt, apraino}@us.ibm.com http://www.research.ibm.com/weather/DT.html
Customization of a Mesoscale Numerical Weather Prediction System for Energy Industry Applications • Background and motivation • Architecture and implementation • Customization for energy applications • Energy Distribution • Energy Generation • Discussion, conclusions and future work
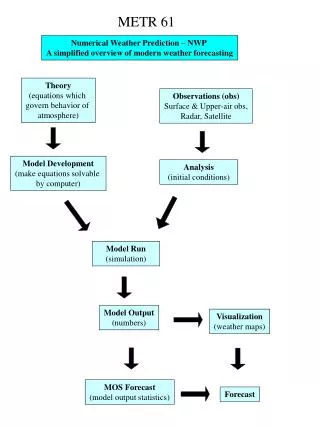
Background and Motivation • Estimated impact of weather on all types of energy & sanitary service across all geographic and temporal scales in the US is ~$230B/year • $ 0.1B to $1B per year for US energy industry related to poor temperature forecasts • Weather-sensitive utility operations are often reactive to short-term (3 to 36 hours), local conditions (city, county, state) due to unavailability of appropriate predicted data at this scale • Mesoscale (cloud-scale) NWP has shown "promise" for years as a potential enabler of proactive decision making for both economic and societal value
Background and Motivation • Despite the "promise" of cloud-scale NWP • Can models be coupled to weather sensitive business problems to demonstrate real value? • Can a practical and usable system be implemented at reasonable cost? • Evaluate concept via implementations in several location around the country. • New York domain has the longest operational history • Operational end-to-end infrastructure and automation with focus on HPC, visualization and system integration • Forecasts to 1 km resolution for metropolitan area with 3 to 21 hours lead time • Prototype applications with actual end users
Model Forecast Domains • Triply nested telescoping grids • Modelling code derived from highly modified version of non-hydrostatic RAMS • Explicit, full cloud microphysics • Typically, one or two 24-hour runs per day • NAM-212/215 via NOAAport for lateral boundaries nudged every 3 hours • NAM-212/215 for initial conditions after isentropic analysis
Implementation and Architecture • Sufficiently fast (>10x real-time), robust, reliable and affordable • E.g., 1.5 hours (42x375MHz Power3), 2.0 hours (24x375MHz Power3) • Focus on HPC, visualization, system integration and automation • Ability to provide usable products in a timely manner • Visualization integrated into all components Post-processing and Tracking Weather Data Pre-processing Processing RS/6000 SP Synoptic Model ETA NOAAPORT Data Ingest Advanced Visualization Boundary Conditions FCST Weather Server Other Input Products Data Explorer NCEP Forecast Products Satellite Images Other NWS Data http://www... Forecast Modelling Systems Analysis Initial Conditions Custom Products for Business Applications and Traditional Weather Graphics Analysis Cloud-Scale Model Observations Data Assimilation
Visualization Component • Traditional meteorological visualization is typically driven by data for analysis -- inappropriate for energy utility applications • Timely usability of cloud-scale NWP results requires • Understanding of how weather data need to be used for end users • Identification of user goals, which are mapped to visualization tasks • Mapping of data to visualization tasks • Users have limited control over content (targeted design) and simple interaction • Products designed in terms relevant for user • Wide range of generic capabilities needed • Line plots to 2d maps to 3d animations -- but customized • Assessment, decision support, analysis and communications • Automated (parallelized) generation of products for web dissemination • Highly interactive applications on workstations
Example Customizations for Utility Operations • Distribution operations • Generation operations
Electricity Transmission • New York State Transmission System • Color-contoured to show forecasted temperature • Available in 10 minute intervals from each 24-hour Deep Thunder forecast at 4 and 1 km resolution • Can be used to estimate transmission efficiency • 115 kV and above • Map also shows • State and county boundaries • Major cities
Example -- Electricity Demand Forecasting • Simple estimated load • f(t,T,H) -- color and height • Scaled by capacity • Generator data from Georgia Power • Deep Thunder forecast • Map shows • Heat index • State & county boundaries • Major cities • Generating plants
Emergency Planning for Severe Winds • Geographic correlation of demographic and forecast data • Map shows • Zip code locations colored by wind-induced residential building damage • Constrained by value, population and wind damage above thresholds
Summary • Deep Thunder is an integrated system that is • Usable forecasts are available automatically, in a timely, regular fashion • Illustrates the viablity of cloud-scale weather modelling to provide more precise forecasts of severe weather • Can be customized for different business applications and processes for safety, economic benefit and efficiency • Continued research and development • Improving quality of forecasts as well as product delivery • Adaptation of other research efforts to support operational applications • Multiple model forecast domains as platforms for development and collaboration • Future work • Adaptation and evaluation to other geographic areas • Enhanced workstation and web-based visualization, model tracking/steering and interactivity for both decision support and analysis • Improved computational performance and throughput • Extensions to still other models and data products • Customized interfaces, products and packaging for other applications (e.g., emergency planning, aviation, surface transportation, broadcast, insurance, agriculture, etc.)