Download
1 / 24
240 likes | 382 Views
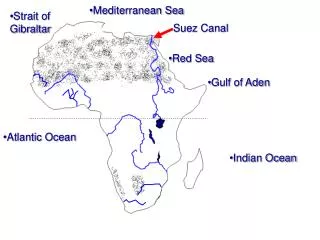
Some Peculiarities of Case 1 Waters Optical Properties in the Northwestern Mediterranean Sea (“BOUSSOLE” site, 43°22 ’N; 7°54 ’E). David ANTOINE André MOREL, Hervé CLAUSTRE Laboratoire d’Océanographie de Villefranche, 06238 Villefranche sur mer, France. The “problem” we aim at.

E N D
Some Peculiarities of Case 1 Waters Optical Properties in the Northwestern Mediterranean Sea (“BOUSSOLE” site, 43°22 ’N; 7°54 ’E) David ANTOINE André MOREL, Hervé CLAUSTRE Laboratoire d’Océanographie de Villefranche, 06238 Villefranche sur mer, France
The “problem” we aim at Bricaud et al. (1998) Morel and Maritorena (2001) Natural variability of Case 1 waters optical properties is known Can we explain this variability in terms of the AOPs versus IOPs relationships ?
Our approach to understand the natural variability of the AOPs and IOPs Combination of - A time series with ~monthly resolution (ship operations) - A high-frequency (i.e., 15 min.) permanent sampling near the surface with a new type of optical mooring - Collection of a full set of IOPs, needed to understand the AOPs and their “anomalies” with respect to standard, global, models (--> closure)
The site where we collect data : “BOUSSOLE” site & program “Buoy for the acquisition of a long-term (bio)optical series” Monthly cruises (started July 2001) + a new type of optical buoy (since Sept. 2003) Marine optics, Bio-optics, Ocean color calibration / validation program (MERIS, SeaWiFS, POLDER)
Site characteristics (oligotrophic to eutrophic) Winter, maximum of the water mixing Chl up to ~2-3 mg m-3 mixed layer down to 200 meters Summer, maximum of the stratification. DCM is maximum, with surface Chl ~ 0.05 mg m-3 (up to 1 in the DCM) Spring, establishment of the deep chlorophyll maximum around 50 meters Chl ~ 0.3 mg m-3 Fall, erosion of the thermocline, the DCM progressively disappears Chl ~ 0.5 mg m-3
SeaWiFS chlorophyll 2001-2004 Feb March Apr May June Jul Sept Oct Nov Dec 2001 2002 2003 2004 SeaWiFS/SIMBIOS diagnostic data sets (http://seawifs.gsfc.nasa.gov/cgi/seawifs_region_extracts.pl?TYP=ocean)
Start of the optics time series SeaWiFS OC4v4, rep. #4 in situ Tchla Regional algorithm (Bricaud et al., 2001) “Anomalies” we already know Chlorophyll time series at the DYFAMED site
SeaWiFS OC4v4, rep. #4 Regional algorithm (Bricaud et al., 2001) May 1999 SeaWiFS composite
Already identified anomalous Blue-to-green ratios Claustre et al., 2002 (Geophys. Res. Letters) (PROSOPE cruise) And others : (Gitelson et al., 1996 D’Ortenzio et al., 2001, 2002 Corsini et al., 2002) Possible cause : deposition of small dust particles coming from Sahara, reinforcing absorption in the blue and scattering in the green Morel & Maritorena (2001).
Which AOPs/IOPs we are looking at AOPs (using a Satlantic 13-wavelengths “SPMR” radiometer) Irradiance reflectances at the “0-” level, and normalized for a sun at zenith : R(l) = Eu(l1)/Ed(l2) “Blue-to-green reflectance ratios” R(l1)/R(l2) Diffuse attenuation coefficients for the downwelling irradiance : Kd(l) = -d[ln(Ed(l)] / dZ IOPs (Wetlabs’ AC9 & particulate absorption on filtered samples) Total absorption, scattering, attenuation Particulate absorption (total, phytoplankton, detritus)
Time series of the blue-to-green ratio Model Data “reconstructed” Chl in situ Chl R(443)/R(560)
Time series of the blue-to-green ratio R(490)/R(560)
Time series of the blue-to-green ratio R(510)/R(560)
Time series of the Kd’s 412 nm 443 nm 490 nm
Time series of the Kd’s (continued) 510 nm 560 nm 670 nm
Time series of the reflectances 412 nm 443 nm 490 nm
Time series of the reflectances (cont’d) 510 nm 560 nm 670 nm
Time series of particulate absorption coefficients Summer : absorption by detritus is at least equal to, and actually greater than, phytoplankton absorption Year 2003 only Winter : phytoplankton absorption dominates
Particulate absorption spectra February March ap af ad May July ap is decomposed into af and ad following Bricaud and Stramski, 1990
Spectra of the total (minus water) absorption and scattering coefficient February April c(l) b(l) a(l) May July
Loisel & Morel (1998) (+/- a factor of 2) A lot of detritus in summer « Fresh bloom » ? Particulate scattering coefficient at 550 nm as a function of Chl from AC9 measurements
In short... The “summer anomaly” - “Lower-than-expected” reflectances in the blue are due to high absorption : several causes are possibly intermingled, such as Saharan dust, detritus, CDOM... - “Greater-than-expected” reflectances in the green : Saharan dust, detritus, others (coccolithophorids) ? - It is not a permanent feature The “winter anomaly” - “Greater-than-expected” reflectances in the blue might be due to a lower absorption : “fresh phytoplankton bloom” with a lower proportion of detritus - “Lower-than-expected” reflectances in the green : could be due to large proportion of big cells
General conclusions, perspectives - The preliminary analysis of the AOPs and IOPs time series has confirmed some trends already observed in the Med. Sea (although not permanent), and revealed others - Anomalies in the AOPs can be explained in terms of the IOPs, yet fundamental causes remain to be ascertained. - Understanding of the causes requires further analysis of the data, and may require as well some additional parameters (in particular CDOM absorption, backscattering coefficient, AOPs in the UV), as well as inversion of the AOPs into IOPs (e.g., Loisel and Stramski 2001) - Exploitation of the buoy time series (AOPs, c(660), bb(443 & 550)) should help in this respect - Any index in the reflectance spectra that may help in a better interpretation of the remotely-sensed observations ?
Acknowledgements Alec SCOTT, Chief engineer for the project, monthly cruises, AOPs collection, data processing Bernard GENTILI, Data processing codes Davy MERIEN Joséphine RAS, HPLC and ap measurements Dominique TAILLIEZ, CTD + IOPs, monthly cruises R/V Téthys-II Captains & crews Thank you for your attention