Download
1 / 21
210 likes | 336 Views
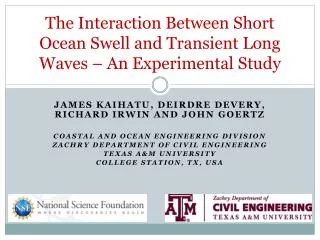
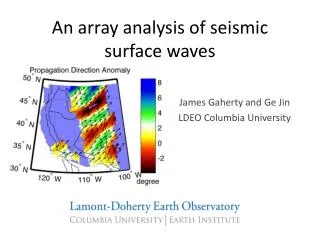
Interaction of Tsunamis with Short Surface Waves: An Experimental Study. James M. Kaihatu Texas Engineering Experiment Station Zachry Department of Civil Engineering Texas A&M University College Station, TX, USA. Motivation. 2004 Indian Ocean Tsunami from Koh Jum Island. Motivation.

E N D
Interaction of Tsunamis with Short Surface Waves: An Experimental Study James M. Kaihatu Texas Engineering Experiment Station Zachry Department of Civil Engineering Texas A&M University College Station, TX, USA Quake 2011, Buffalo NY 9-11 June 2011
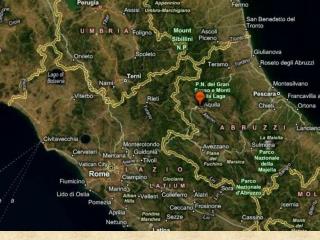
Motivation 2004 Indian Ocean Tsunami from KohJum Island Quake 2011, Buffalo NY 9-11 June 2011
Motivation • Generally – default paradigm for tsunamis: solitary wave • Used for lab studies of tsunami damage • Madsen et al. (2008) • Solitary wave paradigm flawed • Cause order of magnitude errors in spatial and temporal evolution over a sloping bottom Quake 2011, Buffalo NY 9-11 June 2011
Interaction with the Swell Wave Field • Hypothesis: • Overlying swell wavefield can have some subtle effect on underlying tsunami • Front face steepness • Wave-wave interaction • Run long wave through random swell field • Use transient analysis (wavelet, Hilbert-Huang) to investigate effects Quake 2011, Buffalo NY 9-11 June 2011
NEES Payload • One year project from NEES program, National Science Foundation • Use NEES Tsunami facility at Oregon State University • Tsunami Wave Basin: • 48.8m x 26.5m x 2.1m • 29-paddle multi-directional piston wavemaker • 4 resistance gages and 2 ADVs on movable bridge Quake 2011, Buffalo NY 9-11 June 2011
Test Conditions Gage 1 Gage 8 Gage 16 Gage 20 Tsunami “height” ~30 cm Water depth 0.75 m Different runs with tsunami either in middle or end of swell record Quake 2011, Buffalo NY 9-11 June 2011
Experiments Tsunami Only Tsunami with Swell Quake 2011, Buffalo NY 9-11 June 2011
Wavelet Analysis • Morlet Wavelet Transform • Data from experiment – periodic signal interacting with a transient signal • Standard Fourier Transform techniques not suitable • Wavelet transform – time-dependent frequencies • Spectral densities as a function of frequency and time The Morlet Wavelet Quake 2011, Buffalo NY 9-11 June 2011
Wavelet Analysis Gage 1 Gage 8 Gage 16 Gage 20 Tsunami Only Quake 2011, Buffalo NY 9-11 June 2011
Wavelet Analysis Gage 1 Gage 8 Gage 16 Gage 20 Tsunami with Swell: Hs=5cm, Tp=2s Quake 2011, Buffalo NY 9-11 June 2011
Wavelet Analysis Gage 1 Gage 8 Gage 16 Gage 20 Tsunami with Swell: Hs=5cm, Tp=4s Quake 2011, Buffalo NY 9-11 June 2011
Hilbert-Huang Transform • Hilbert Transform plus Empirical Model Decomposition • Take original nonperiodic signal • Calculate envelope with Hilbert Transform, then calculate mean • Subtract mean from original signal • New signal • Do this on each updated signal k times • Result – mode c1 • Subtract mode c1 from original data – obtain new data • Perform sifting process again • Advantage: • No apriori basis function • Modes usually have some physical basis Top: Cnoidal wave. Bottom. First five HHT modes of cnoidal wave. Quake 2011, Buffalo NY 9-11 June 2011
HHT of Tsunami 1 1 8 8 16 16 20 20 1 5 2 6 3 7 4 8 Blue: Gage 1 Green: Gage 8 Blue: Gage 16 Green: Gage 20 Blue: Gage 1 Green: Gage 8 Blue: Gage 16 Green: Gage 20
HHT of Combined Tsunami-Swell 1 1 8 8 16 16 20 20 1 5 2 6 3 7 4 8 Blue: Gage 1 Green: Gage 8 Blue: Gage 16 Green: Gage 20 Blue: Gage 1 Green: Gage 8 Blue: Gage 16 Green: Gage 20 Quake 2011, Buffalo NY 9-11 June 2011
Steepness • Breaking: related to wave steepness : • Deduce steepness from: • Time series • Combined HHT modes (long/short motions) • Look for maximum steepness Approximate steepness by linear wave equation: Quake 2011, Buffalo NY 9-11 June 2011
Steepness 1 1 8 8 16 16 20 20 Blue: Tsunami Green: Tsunami with swell Red: Tsunami with swell – long wave Blue: Swell only Green: Swell with tsunami Red: Swell with tsunami – short wave Quake 2011, Buffalo NY 9-11 June 2011
Conclusions and Future Work • It was hypothesized that the overlying swell field might have some effect on a long tsunami (front face steepness, etc.) • Experiments were run at the NEES Tsunami Facility at Oregon State University • Some indication of swell affecting maximum surface amplitude of overall wave field • Wavelet analysis: spectral structure of tsunami affected by swell • Use Hilbert-Huang Transform to break motion up into scales • Analysis of steepness in combined motion: strong energy shift to high frequencies made more efficient with swell present. Quake 2011, Buffalo NY 9-11 June 2011
Analysis • Maximum Surface Elevation • As proxy for waveheight: maximum surface elevation in record • Maximum surface elevation reached earlier with combined conditions than with either alone. • Different results with tsunami in middle or at end of swell record. Blue: Tsunami Black: Swell Red: Combined Tsunami at End Blue: Tsunami Black: Swell Red: Combined Without Swell With Swell Tsunami in Middle Quake 2011, Buffalo NY 9-11 June 2011
Wavelet Bicoherence • Bispectra using Wavelets • Determine the frequencies which contribute to the interaction. • Analogous to using Fourier analysis to provide bispectral estimates Quake 2011, Buffalo NY 9-11 June 2011 From Dong et al. (2008)
Wavelet Analysis Gage 1 Gage 8 Gage 20 Gage 16 Tsunami with Swell: Hs=10cm, Tp=2s Quake 2011, Buffalo NY 9-11 June 2011
Wavelet Analysis Gage 8 Gage 1 Gage 16 Gage 20 Tsunami with Swell: Hs=10cm, Tp=4s Quake 2011, Buffalo NY 9-11 June 2011