Download
1 / 48
480 likes | 632 Views
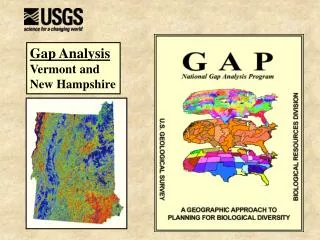
Flash Flood Composite Analysis in Vermont and Northern New York. John M. Goff Gregory A. Hanson NWS Burlington, VT. Impetus for study. Since 1990, 20 of 25 federally declared disasters in Vermont were attributed to flooding.

E N D
Flash Flood Composite Analysis in Vermont and Northern New York John M. Goff Gregory A. Hanson NWS Burlington, VT
Impetus for study • Since 1990, 20 of 25 federally declared disasters in Vermont were attributed to flooding. • Flash flood detection remains a challenging process in the Burlington, VT CWA.
Overview • North American Regional Reanalysis (NARR) composites • Atmospheric sounding analysis • Distribution analysis of key sounding parameters • Spatial distribution of events
NARR Analysis Methodology • Flash flood cases between 1981 and 2010 were analyzed (30-year period). - from archived AWIPS data and a local study (Breitbach 2009). • Data availability and temporal restraints narrowed dataset to 51 total cases for NARR analysis.
NARR Analysis - Isotachs * Weak flow less than 6 m/s below 850 mb. * Modest flow at mid and upper levels. * Coupled jet structure at mid and upper levels.
NARR Analysis – Height/MSLP * Modest front or trough evident at surface. * Broad weak troughing aloft from 850 mb through 250 mb.
NARR Analysis - Moisture * Distinct moisture plume extending north/northeast along surface trough into study area. * Enhanced boundary layer moisture convergence from eastern NY into central/northern New England.
NARR Analysis - Stability * Only modest instability present with LI values generally from -2 to 0°K and CAPE from 500-800 J/kg. * Little to no convective inhibition present. * Supports idea of modest though not excessive updraft strength.
Sounding Methodology • Used RAOB software • 17 of original 51 cases • Limited by local archive of RUC Bufkit data • Soundings analyzed on an individual basis due to limited sample size. - Wind and thermal structure - Distribution of key moisture parameters
Sample Sounding(Wind and Thermal Structure) * Light winds generally 20 kt or less in the boundary layer. * Modest winds aloft in the 25 to 45 kt range. * Modest veering/WAA boundary layer profile. * Light to modest values of shear.
Sample Sounding(Moisture and Instability) * Deep WCD indicative of warm rain processes at work. * Modest CAPE/N-CAPE values support only modest updraft strength. * Low LCL values suggest inhibition of moist downdraft production and limited cell movement.
Distribution of Key Sounding Parameters • PWAT • WBZ height • WCD • LCL height
PWAT Distribution * PWAT values not excessive (1.5 -2.0”). * Mean value of 1.77” not all that unusual, only 117.3% of normal mid-summer value (1.51”).
WBZ Height Distribution * Relatively high values ranging from 10,077’ to 14,533’ AGL. * Non-normal distribution of data, though not surprising.
WCD Distribution * 15 of 17 cases above 3.0 km and a median value of 3.7 km. * Supports prior research (Davis, 2004) suggesting deep WCD layers are a driving factor in many flash flood events. * Therefore it is hypothesized that WCD is a more important signal during potential flash flood days than PWAT or WBZ height.
LCL Height Distribution * All but 2 cases below 1,500’ AGL and 12 cases below 1,000’ AGL. * Low values in combination with high WCDs act to inhibit dry air entrainment and subsequent moist downdraft formation, thus limiting cell propagation. * Low LCL heights seemed to have the strongest signal during potential flash flood days of the 4 parameters analyzed.
Spatial Distribution of Events • Used entire 211 case dataset from Breitbach 2009 • Determine whether spatial variability of events are a function of… - Orography - Population Density
New York Events • * Noticeable clustering of events along eastern slopes of Adirondacks highlighting orographical influence in this region. • Population bias evident along Route 86 in Lake Placid/Saranac Lake area. Also in SLV/Malone. • Also little to no reports in the Adirondacks.
Vermont Events • * Flash flood events more homogeneous in Vermont than in New York. • Some evidence of population bias in northeastern Vermont – low density. • Also small clusters in favored towns along western slopes of Greens
Conclusions - NARR Analysis • NARR analysis indicated flash flood events characterized by: - relatively weak surface to mid-level troughing - modestly coupled mid to upper level jet - south to north oriented deep moisture axis - only modest instability
Conclusions - Sounding Analysis • Soundings characterized by: - light to modest flow throughout the column - distinct veering/WAA profile in the boundary layer - modest values of CAPE/N-CAPE
Conclusions - Sounding Analysis • Soundings characterized by: - modestly high PWAT values near 1.75” - a deep WCD greater than 3.0 km and WBZ heights generally from 10-14 kft AGL - very low LCL heights below 1,500’ AGL
Conclusions – Event Spatial Distribution • Orography likely a role along eastern slopes of Adirondacks • Population density possibly introduces report bias, especially in northern NY and northeastern VT • Predictability of report location somewhat greater in NY than in VT.
Operational Aids • Two Procedures in AWIPS: - User (Default) Procedure (Heavy Pcpn) Flash Flood Potl #1 Flash Flood Potl #2
Operational Aids • Don’t forget about FFMP • FFPI (Nathan & Chuck)
Limitations and Further Study • Study did not examine antecedent conditions such as prior 24-hour rainfall or soil moisture. • Sample size of sounding database. • Build a more comprehensive database of archived events.
Classification of Event Convective Modes • Prior studies: - Gallus et al. 2008; Schumacher and Johnson 2005 • Classified 17 RUC archived sounding events into 3 convective mode types: - Type A: Isolated storm - Type B: Classic training storms - Type C: Meso-beta features (MCS/MCC etc) • Distribution analysis • Differences in sounding profiles
Motivation • Do discrete differences in synoptic or thermodynamic profiles exist among modes? • Based on findings, is it plausible to predict “mode of the day”.
Event Convective Mode(Radar Evolution) * a) Isolated storm, b) Classic training cells, c) MCC/MCS
Type A Profile • The isolated storm… Bristol, VT - 08.28.2004
Type A Profile • * 17% of cases (3); small dataset limited overall conclusions. • * Highest CAPE/N-CAPE and LCL heights imply a deeper/warmer boundary layer. • * Lightest and most westerly low to mid-level wind profile of the three types.
Type A Profile • Mean westerly flow at mid-levels orthogonal to western slopes of Green Mountains, suggesting a mechanism by which Type A storms could become anchored to terrain. • Plausibly light easterly flow could produce similar storms along the eastern slopes of the Adirondacks, though observational analysis suggests lake breeze interaction typically initiates slow movement.
Type A NARR Composite Heights * While limited, data suggests Type A cases arise when a weak surface trough is bridged aloft by weak to modest ridging.
Type B Profile • Classic training cells… Plainfield, VT 05.27.2011
Type B Profile * 71% of cases (12); sounding parameters thus similar to the mean sounding. * Slightly more wind than in Type A cases, but more marked veering in the boundary layer. * Deepest WCD value of the three plots indicating at least the potential for Type B events to produce the highest rainfall rates.
Type C Profile • Mesoscale Convective Systems… Hancock, VT 08.06.2008
Type C Profile * 12% of cases (2). * Minimal instability and coolest thermal profile among the three types. * Light winds throughout the sounding, though most strongly veered implying more marked WAA signature in lower levels.
Type C Profile Type C • Larger meso-beta scale of Type C events suggest more widespread threat of flash flooding than in Type A or B events despite being less common. • Does not imply greater severity threat however. Type B Type A
Conclusions • Type A - smallest footprint - lightest wind flow (mainly westerly) - deepest/warmest boundary layer of the three types - weak low level trough bridged aloft by 500 mb ridging • Type B - most common - winds slightly stronger than in Type A cases - more veering profile in the boundary layer - deepest WCD potential for higher rainfall rates
Conclusions • Type C - low instability and profile cooler than Types A and B - light winds but WAA stronger with marked low level veering - largest in scale of the 3 types potential of more widespread flash flooding
Limitations • Small sample size (17) limited compositing value. - Note: many more are archived in AWIPS, just not for BUFKIT • An even smaller number of type cases - Type A 3 cases - Type B 12 cases - Type C 2 cases
References • Breitbach, M., 2009: Flash Flooding Climatology (1975-2009) for the WFO Burlington, VT County Warning Area. Poster, NWS Eastern Region Flash Flood Conference 2009. • Chappell, C. F., 1986: Quasi-Stationary Convective Events. Mesoscale Meteorology and Forecasting, P.S. Ray, Ed., Amer. Meteor. Soc., 289-310. • Chappell, C. F., 1993: Dissecting the Flash Flood Forecasting Problem. Post-Print Volume, Third Heavy Precipitation Workshop, NOAA Tech Memo. NWS ER-87, 293-297. • Cope, A. M., and L. R. Robinson, 2007: Composite Means and Anomalies of Meteorological Parameters for Summertime Flash Flooding in the National Weather Service Eastern Region. 22nd Conf. on Wea. Anal. And Fcstg., June 2007. • Davis, R. S., 2001: Flash Flood Forecast and Detection Methods. Severe Convective Storms, Meteor. Monogr., No. 50, Amer. Meteor. Soc., 481-525. • Davis, R. S., 2004: The Impact of Tropical Rainfall Rates on Flash Flood Detection. Preprints, 22nd Conference on Severe Local Storms, AMS, compact disk. • Federal Emergency Management Agency, cited 2011: Vermont State Disaster History. [Available online at http://www.fema.gov/news/disasters_state.fema?id=50.] • Hanson, G., 2004: 28 August 2004 Flash Flood in Addison County Vermont. 6th Northeast Regional Operational Workshop, November 2004. • Harnack, R., K. Apffel, M. Georgescu, and S. Baines, 2001: The Determination of Observed Atmospheric Differences between Heavy and Light Precipitation Events in New Jersey, USA. Int. J. Climatol., 21, 1529-1560. • Jessup, S. M., and A. T. DeGaetano, 2008: A Statistical Comparison of the Properties of Flash Flooding and Nonflooding Precipitation Events in Portions of New York and Pennsylvania. Wea. Forecasting, 23, 114-130. • LaPenta, K. D., and Coauthors, 1995: The Challenge of Forecasting Significant Rain and Flooding Throughout the Eastern Region of the National Weather Service. Part I: Characteristics and Events. Wea. Forecasting, 10, 78-90. • Maddox, R. A., C. F. Chappell, and L. R. Hoxit, 1979: Synoptic and Mesoscale Aspects of Flash Flood Events. Bull. Amer. Meteor. Soc., 60, 115-123. • Mesinger, F., and Coauthors, 2006: North American Regional Reanalysis. Bull. Amer. Meteor. Soc., 87, 343-360. • National Weather Service, cited 2011: Precipitable Water Plots. [Available online at http://www.crh.noaa.gov/unr/?n=pw] • Pontrelli, M. D., G. Bryan, and J. M. Fritsch, 1999: The Madison County, Virginia, Flash Flood of 27 June 1995. Wea. Forecasting, 14, 384-404.
Acknowledgements • Paul Sisson (SOO NWS BTV) for oversight and review. • Nathan Foster (OPL NWS BTV) for ArcGIS mapping.