Download
1 / 28
280 likes | 432 Views
Measures of Academic Progress. Growth Modeling vs. Proficiency Adaptive Testing vs. Fixed Form Curriculum Check. Identification GT Students with Disabilities Leveling Projected Proficiency. www.nwea.org. Take a guided tour. Data to inform decisions. District Programs.

E N D
Measures of Academic Progress • Growth Modeling vs. Proficiency • Adaptive Testing vs. Fixed Form • Curriculum Check • Identification • GT • Students with Disabilities • Leveling • Projected Proficiency
www.nwea.org Take a guided tour
Data to inform decisions District Programs
Measures of Academic Progress Computer-Adaptive Assessments • MAP Reading – Language Usage – Mathematics (Package) • MAP for Primary Grades - Reading/Math - Headphones • MAP Science • MAP Spanish Audio Mathematics
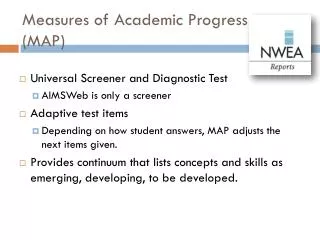
What information can you obtain from NWEA assessments? • Diagnostic instructional level data • Student growth data • Normative data • Projected proficiency for state tests* • *In states with completed alignment studies NWEA
What information can you obtain from NWEA assessments? • Growth trajectories • Program placement guidelines • Intake data on enrollment • Grade, school and district-wide data • Reading Lexile data NWEA
Measuring Learning Growth RIT Scale 280 6’ • Just as we can use a tape to measure a child’s height . . . • We can use the RIT Scale to measure a child’s learning growth . . . 2’ 150
RIT (Rasch Unit) Scale • Linked to curriculum • Achievement scale • Equal interval • Cross graded growth measurement • Shows growth over time Adult Reading 280 RIT SCALE Test items are calibrated for difficulty along the RIT scale. 150 Beginning Literacy
Design of Conventional Assessments • Purpose is external accountability - usually • Measure grade specific curriculum • Measure average students in a grade Adult Reading 12 5th Grade K Beginning Literacy
Reality… Grace Typical classroom represented by Norm Daniel Grace Norm 5th Grade Daniel
Design & Features of MAP (computer-adaptive tests) • Each test is dynamically developed for each student • Accurate data for students across the scale – after about 6-8 questions – the system levels the student • Tests are not timed • Immediate results • Can test up to 4 times a year (with exception of science) • Large item bank Upper Math MAP __ RIT Scale 12 + Grace + + + + - - 223 7th + + 5th Grade - - - + Daniel - - - + + + + + 201 4th K Beginning Math INDIVIDUALIZED assessment for each child
Resources And Tools
NWEA MAP REPORTS • Standard Package • Teacher Reports (MAP – within 24 hrs. after upload – Password) • Summary Reports (MAP – within 72 hrs. after all testing is done - data uploaded to NWEA) • Class Report • Individual Student/Parent Reports • School Summary Reports • District Summary Reports • Etc. • Dynamic Reporting Suite - reports developed for teacher views and administrator views
Another view of the data . . . using tables Flexibility to choose different formats for reporting Select Reports – Page 13
NWEA tools to inform instruction Dynamic Reporting Suite
Uses of DesCartesAligned to goal structures and content standards of your state • Resource for targeting and differentiating individual instruction • Resource for curriculum revision • Resource for school improvement planning • Tool to monitor student progress • Resource for parent conferencing and partnering with parents for enrichment
INDIVIDUALIZED assessment – linked to instruction for each child
Lexile Resources www.lexile.com • RIT Scale is aligned with the Lexile Score • Helpful to teachers and parents in choosing • appropriate reading materials • Use to create theme units with appropriate • reading materials for every child • Use to purchase books for school and • classroom libraries • A Lexile measure represents the level at which students can read at 75% • comprehension