Download
1 / 39
390 likes | 511 Views
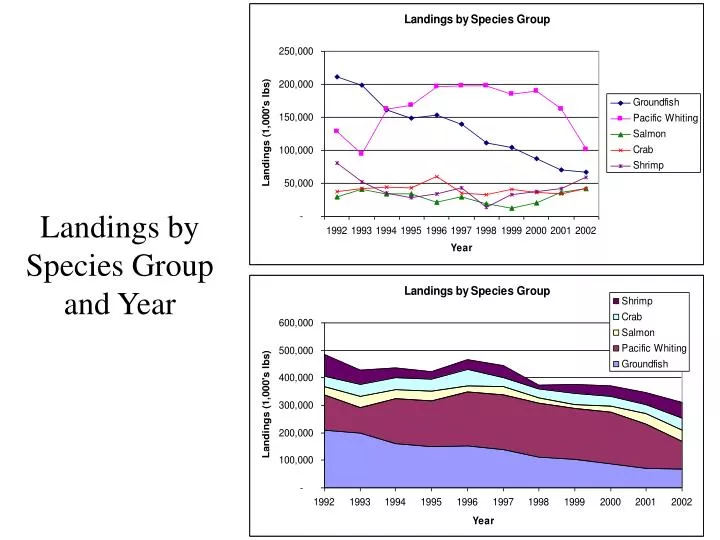
Landings by Species Group and Year. Revenue by Species Group. Landed Weights and Revenue for All Species. Landed Weight and Revenue for Salmon. Landed Weight and Revenue for Shrimp. Landed Weight and Revenue for Crab. Landed Weight and Revenue for Pacific Whiting.

E N D
2002 Gear Combinations with Revenue <$10,000 Distribution of Counts and Revenue for Gear (Trawl, Net and Pot) Combination in 2002 with Vessel Revenue <$10,000Note: Size of circle and overlap is proportionally correct to number of vessels using the gear combinations for all species.
2002 Gear Combinations Distribution of Counts and Revenue for Gear (Trawl, Net and Pot) Combination in 2002 Note: Size of circle and overlap is proportionally correct to number of vessels using the gear combinations for all species.
2001 Gear Combinations Distribution of Counts and Revenue for Gear (Trawl, Net and Pot) Combination in 2001Note: Size of circle and overlap is proportionally correct to number of vessels using the gear combinations for all species.
2000 Gear Combinations Distribution of Counts and Revenue for Gear (Trawl, Net and Pot) Combination in 2000Note: Size of circle and overlap is proportionally correct to number of vessels using the gear combinations for all species.
1999 Gear Combinations Distribution of Counts and Revenue for Gear (Trawl, Net and Pot) Combination in 1999Note: Size of circle and overlap is proportionally correct to number of vessels using the gear combinations for all species.
1998 Gear Combinations Distribution of Counts and Revenue for Gear (Trawl, Net and Pot) Combination in 1998 Note: Size of circle and overlap is proportionally correct to number of vessels using the gear combinations for all species.
1997 Gear Combinations Distribution of Counts and Revenue for Gear (Trawl, Net and Pot) Combination in 1997Note: Size of circle and overlap is proportionally correct to number of vessels using the gear combinations for all species.
1996 Gear Combinations Distribution of Counts and Revenue for Gear (Trawl, Net and Pot) Combination in 1996Note: Size of circle and overlap is proportionally correct to number of vessels using the gear combinations for all species.
1995 Gear Combinations Distribution of Counts and Revenue for Gear (Trawl, Net and Pot) Combination in 1995Note: Size of circle and overlap is proportionally correct to number of vessels using the gear combinations for all species.
1994 Gear Combinations Distribution of Counts and Revenue for Gear (Trawl, Net and Pot) Combination in 1994Note: Size of circle and overlap is proportionally correct to number of vessels using the gear combinations for all species.
1993 Gear Combinations Distribution of Counts and Revenue for Gear (Trawl, Net and Pot) Combination in 1993Note: Size of circle and overlap is proportionally correct to number of vessels using the gear combinations for all species.
1992 Gear Combinations Distribution of Counts and Revenue for Gear (Trawl, Net and Pot) Combination in 1992Note: Size of circle and overlap is proportionally correct to number of vessels using the gear combinations for all species.