Download
1 / 29
290 likes | 455 Views
I. Evidence of Rapid Flux Emergence Associated with the M8.7 Flare on 2002 July 26. Wang H. et al. 2004, ApJ, 605, 931 --using high temporal resolution BBSO vector magnetograms. Liu 2004-04-26 Kyoto Univ. Introduction.

E N D
I. Evidence of Rapid FluxEmergence Associated with the M8.7 Flare on 2002 July 26 Wang H. et al. 2004, ApJ, 605, 931 --usinghigh temporal resolution BBSO vector magnetograms Liu 2004-04-26 Kyoto Univ.
Introduction • Flare-associated phenomena, e.g., emergence of magnetic flux and enhancement of magnetic shear, are undoubtedly important for understanding the basic physical process during solar flares. However, results from many previous studies are inconclusive or contrary
For example, some people thought that rapid flux increase might be a common property of major solar flares (Kosovichev & Zharkova 2001; Spirock et al. 2002, Wang et al. 2002). However, Green et al. (2003) pointed out that no systematical or permanent magnetic changes associated with flares. • Studies on relationship between flares and the magnetic nonpotentiality (e.g., magnetic shear) also present different results (decrease, increase or unchange)
In the present work, comprehensive coordinated observations supplied for an M-class flare, clearly showing an emerging flux as a trigger or a participant for the reconnection, associated with obvious enhancement of Bz, Bt and shear angle
Observations • BBSO 19:00-24:00 UT Hα (1”, 1min; 300”X300”) magnetogram(0.6”, 1min; 2G - Bz, 20 G-Bt) • TRACE 1600 Å and 171 Å ( 0.5” ) • SOHO MDI ( 2”, 1min ) • RHESSI HXR images • SOHO LASCO/C2 ( halo-CME ) RHESSI 5-10 keV
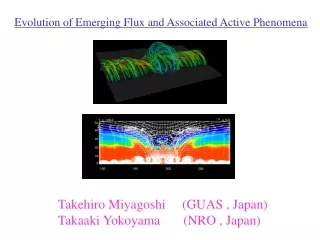
All the observations suggest the fast emergence of new fluxes. It will be interesting to demonstrate in detail the evolution of some important parameters, e.g., Bz, Bt, shear angle, for the emerging flux region northern footpoint southern footpoint post-flare loops in EUV
positive negative • MDI magnetic flux evolution in the field of view M4.6 M5.3 M8.7 GOES SXR flux
parameters unbalanced BBSO - Bz Spirock et al. 2002 weighted mean shear angle (Wang,H., 1992)
TRACE images showing slowly rising post-flare loops which are very flat stable filament evolution of the flare and the filament Hα 21:01 Hα 22:30
Estimation of Erecin the corona ribbon separating speed electric current deduced (Qiu, J., 2002)
Main Conclusions • Both rapid increase of transverse fields and longitudinal fields are observed following the flare, showing a inclined loop emergence • Unbalanced Bz flux evolution observed for the two foot points, also complying the emergence of the low-lying loop deviated from solar center • This rising loop must has a close relationship to the trigger of the CME associated
II. Observations of Nonthermal and Thermal Hard X-Ray Spikes in an M-class Flare Ji, H. et al. 2004, ApJ, 605, 938 -- for the first time to study whether a HXR spike is thermal or nonthermal, with the aid of RHESSI data
Introduction • Research of solar flares information of release of free energy and acceleration of particles • Chromosphere brightening may be caused by nonthermal ionization Hα blue-wing increased emission, highly correlated with HXR sources both in locations and time profiles) • Another heating mechanism is by conduction time delay between HXR and Hα • Maybe both of them can operate in a same flare process • Simultaneous Hαand HXR observations are expected
Introduction • To identify whether it is thermal or nonthermal for a HXR emission is necessary • Two ways : (1) examine the time delay between HXR and Hαemissions (2) study the HXR spectra to give electron distribution • Until the launch of RHESSI is it possible to verify the claims of thermal and nonthermal heating mechanisms • RHESSI is able to provide HXR/γ-ray image and spectrum with spatical resolution (2.3“, full-disk mode), spectral resolution of 1-10 keV and several seconds time resolution, for accurate position information
Observations • BBSO Hα-1.3 Å, 40ms cadence, 0.5” resolution, 256X256 CCD. AR 0105 (2002 Sep 9, S07 E53). M2.3-class flare • RHESSI, 4s time cadence, calibrated light curves and maps, co-aligned with Hα-blue data with an accuracy better than 1” M2.3 flare (17:40-18:30 UT) 50 mins in SXRs and Ha center. About 20 mins in HXR and Ha blue wing
these spiky structures may be discrete impulsive energy release process and represent nonthermal HXR emissions Flare time profiles GOES8 0.5-4.0 Å HXR 15-25 keV 25-50 keV started 2 mins later from softer HXR a1 Hαcenter a2 quite different ? d c+d b Hαcenter c then our basic goals is to find HXR-associated peaks in Ha blue-wing kernels
Five flare ribbons in Ha center, three shown in Ha-1.3Å image (a1, a2, b)
EIT 195Å observation showing a flaring loop, which is thought to be a magnetic loop EIT loop (bright part) a2 a1 RHESSI 12-25 keV (loop-top source) Ha -1.3Å b a1 and a2 are conjugate kernels
a2-a1 Ha blue-wing curves are closely correlated with 25-50 keV HXR curve loop-top source HXR spikes a2 corresponding Ha-1.3Å spikes are found. their life time is 10-20 s 40 s delay a1 b does not resemble HXR profile, but its spikes 6-8 is obvious b
Image X-ray spectra of loop-top source for a number of time periods (I-VI), construct in 6 energy bands (10-12, 12-14, 14-17, 17-20, 20-28, 28-45 keV) The spectra fits are constructed by minimum 2 fitting method (Lampton et al. 1976) period I: heat conduction period II: nonthermal electrons period III: weaker nonthermal In a conclusion: thermalnonthermal hard nonthermal soft, for the impulsive phase of the flare, unlike the usual soft hard soft process =-5.6 -7.0 -7.4 -7.3 integrated flux in a box around the loop-top source
for comparison, 12-25 keV contours and 25-50 keV contours are overlaid on Ha blue-wing image (period II) nonthermal heating Simultaneously rising
for comparison, 12-25 keV contours and 25-50 keV contours are overlaid on Ha blue-wing image (period IV) no detectable footpoint HXR sources 10s the time delay 10s gives a speed of energy transport to be ~1500 km/s, suggesting a heating mechanism by thermal conduction
for comparison, 12-25 keV contours and 25-50 keV contours are overlaid on Ha blue-wing image (period V,VI) weak footpoint HXR emissions period V VI no time delay both of them are nonthermal heating
some discussion about the other ribbons b, c and d kernel b, c and d may be conjugate and should have no direct relation to a1 and a2 for the following reasons: • Kernel b shows poorer temporal correlations with HXR emissions ( e.g., 90 s time lagged for initiation, obviously moving away while a1 and a2 are stably compact, no HXR source associated, bright kernal ended much earlier) • Summed light curve of c and d seems similar to that of b • Their Ha line-center profiles are different from a1 and a2 • c and d in same magnetic polarity of positive, b in negative, so they may be conjugate footpoints. Their brightening may be “remote brightenings” by interaction of flaring loops and preexisting higher loops (Wang H. et al., 2002) or triggered by magnetic instabilities resulted by the M-class flare
Possible reasons why there is no HXR emissions from b • There were no accelerated electrons to this site, heated by thermal conduction • The electron density was too low for the production of HXRs • The dynamic range of HXR maps is relatively low (at present, ~10:1)
observed and predicted nonthermal heating Residual intensity in blue wing Estimation of excess flare emission in Ha blue wing ( Canfield & Gary, 1987) Nearby continuum – constant : electron beam spectral index Nc: cutoff stopping depth -- constant H: pre-flare scale height q: characteristic heating per hydrogen nucleus K: a factor weakly dependent on the beam parameters, -- constant(assuming 10keV for cutoff energy) Predicted ratio: i, j : spike number, and
Two other relations found for and q, therefore, the theoretic ratios of residual intensity for the spikes in H blue wing can be obtained Results
predicted observed observed 1/0.13 1/0.14 Obviously, the first spike (spike 1) did not produce the predicted Ha blue-wing intensity 1/0.37 1/0.39 1/0.59 1/0.60
Summary and Conclusion • In this flare, both nonthermal and thermal heating are revealed by their different properties (HXR emission source, spectral spikes, time delay, et al.) • The thermal heating spike can be fitted by a double-temperature model, with a low energy transportation speed (1500km/s) • It is also found non-HXR emission associated some Ha ribbons, which could be caused by several reasons (remote brightening; flaring loops interaction) • According a comparison between theory and observation for excess flare emission in the Ha blue wing, it is found the first spike did not produce the predicted Ha intensity, which is probably attributed to the delay to ionization of cool chromosphere at the beginning of the flare.