Download
1 / 45
470 likes | 884 Views
Coordinates and Graphs. Year 9. Note 1 : Coordinates. Coordinates can be used to identify a place of interest. Coordinates require 2 references: 1.) Horizontal (written first) 2.) Vertical (written second). Note 1 : Coordinates and Maps. Note 1 : Coordinates and Maps.

E N D
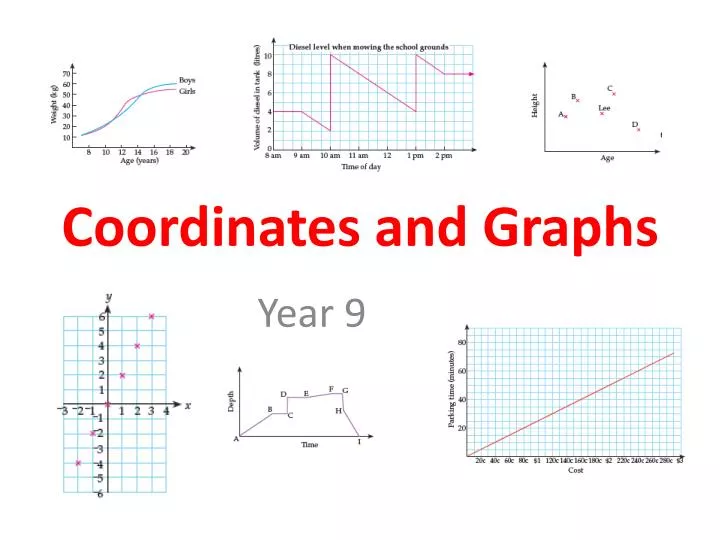
Coordinates and Graphs Year 9
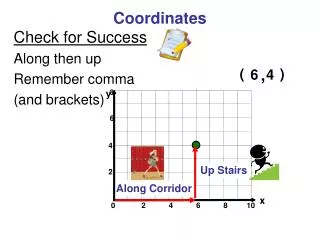
Note 1: Coordinates Coordinates can be used to identify a place of interest. Coordinates require 2 references: 1.) Horizontal (written first) 2.) Vertical (written second)
Note 1: Coordinates and Maps • Topographical Maps show many features including: • heights (elevations) • contours • vegetation • water and coastal features • roads, railways, bridges and tunnels • residential and historical landmarks
Note 1: Coordinates and Maps The caravan park at Orongo Bay has a grid reference 152569 Split the reference into 2 parts The first 3 digits (152) represent the horizontal scale 15.2 The second 3 digits (569) represent the vertical scale 56.9
Note 1: Mathematical Coordinates • In math, we use coordinates to represent a position on a whole number plane (1,3) The coordinate of point A is _______ (5,2) The coordinate of point B is _______ * Remember, the first coordinate gives the distance across (horizontal) and the second gives the distance up (vertical)
Note 1: Mathematical Coordinates (x,y) The horizontal scale is the x-axis The vertical scale is the y-axis
Note 1: Mathematical Coordinates (x,y) The horizontal scale is the x-axis The vertical scale is the y-axis 4 4 2 1 1 5 0 1 3 0 IWBEx 16.01 pg 411-412 Ex 16.02 pg 415-416 Ex 16.03 pg 418-419
Note 2: Coordinates with integers We can extend the x and y axes to include negative numbers (0,0) is the point where the x-axis and the y-axis intersect. This point is called the origin. (x,y) * Remember we always write x before y
Note 2: Coordinates with integers -1 3 -2 -4 5 -2 3 4 0 -2 IWB Ex 16.04 pg 423-424
Note 3: Latitude & Longitude Latitude – horizontal lines (run east –west) e.g. Equator Longtitude – vertical lines (run notrth-south) e.g. Prime Meridian Greenwich, London, England
Note 3: Latitude & Longitude IWB Ex 16.05 pg 431
Note 4: Two-dimensional graphs Scatter Plots • shows the relationship between the two quantities • two axes, each with a different quantity and scale
Note 4: Two-dimensional graphs Scatter Plots This scatter plot shows the relationship between height and age 1.) Who is the youngest? 2.) Who is the tallest? 3.) If these are all children in a single family, who are the twins? 4.) What is the relationship that this graph shows between height and age? Cindy Aaron Bruce & Emma The older a person is, the taller they are (positive relationship)
Note 4: Two-dimensional graphs Scatter Plots This scatter plot shows the distances of some overseas destinations from Auckland airport, and the cost of the return ticket to each one. a.) Which destination is the furthest from Auckland? b.) Which destination is the most expensive to travel to? c.) How does the graph show that the fare to Sydney and Melbourne is the same? Seoul L.A. They are on the same horizontal line With a fare of $500
Note 4: Two-dimensional graphs Scatter Plots This scatter plot shows the distances of some overseas destinations from Auckland airport, and the cost of the return ticket to each one. d.) The distance to Adelaide is 3250 km and the fare is $799, add this to the graph. e.) What relationship does this graph show exists between distance and cost ? The further away destinations are more expensive to travel to (positive relationship)
Note 4: Two-dimensional graphs Line Graphs • Show how one quantity changes as another one does • two axes, each with a different quantity and scale
Note 4: Two-dimensional graphs Line Graphs This graph shows what happens to two plants after they were planted in a garden. One received fertilizer and the other did not. a.) What was their height when they were planted? b.) Which plant grew the fastest? c.) How does the graph show when the plants stop growing? 10 cm Plant A – it has a steeper slope (gradient) Plant A stopped after 16 days and plant B after 18 days – their graph becomes horizontal after day 16 & 18.
Note 4: Two-dimensional graphs Line Graphs Sue is adding water to a storage tank with a hose but doesn’t realize that there is a leak in the tank. When the tank looks full, she stops adding water and walks away. a.) What is the level in the tank when she starts filling it? b.) How long does it take to fill the tank? c.) At what level is there a hole in the tank? 0.4 m = ____ cm 40 20 min IWB Ex 17.01 pg 435 Ex 17.02 pg 440 0.8 m = ____ cm 80
Note 5: Graphs & Coordinate Patterns An algebra rule that links x and y can be used to plot coordinates that produce a pattern on a graph e.g. y = 2x Coordinates (-2,-4) 2×-2 = -4 (-1,-2) 2×-1 = -2 2 × 0 = 0 (0 , 0 ) 2 × 1 = 2 (1 , 2 ) 2 × 2 = 4 (2 , 4 ) (3 , 6 ) 2 × 3 = 6 Once the coordinates are plotted the pattern is obvious Linear
Note 5: Graphs & Coordinate Patterns An algebra rule that links x and y can be used to plot coordinates that produce a pattern on a graph e.g. y = 3x – 1 Coordinates (-2,-7) 3×-2-1 = -7 (-1,-4) 3×-1-1 = -4 3× 0-1 = -1 (0 , -1) 3× 1-1 = 2 (1 , 2 ) 3× 2-1 = 5 (2 , 5 ) (3 , 8 ) 3× 3-1 = 8 Linear Pattern
Note 5: Graphs & Coordinate Patterns Linear Pattern 3 × -1 = -3 (-1,-3) 3 × 0 = 0 (0 , 0) (1 , 3 ) 3 × 1 = 3 3 × 2 = 6 (2 , 6 ) 3 × 3 = 9 (3 , 9 ) IWB Ex 18.01 pg 449-451
Starter y = -2x -1 Linear Pattern -2x – 1 = y (-2, 3) -2 × -2 – 1 = 3 (-1, 1) -2 × -1 – 1 = 1 (0 , -1) -2 × 0 – 1 = -1 -2 × 1 – 1 = -3 (1 ,-3 ) -2 × 2 – 1 = -5 (2 , -5 ) (3 , -7 ) -2 × 3 – 1 = -7
Note 6: Connecting Tables, Rules & Graphs Rule: W = 10 – 2n W = amount of water (L) n = number of minutes elapsed since the bucket was full 1.) What is the value of W when n=1? 2.) How much water is left in the bucket after 2 min.? 8 Litres 6 Litres 3.) How much water is in the bucket when it is full? 4.) How long does it take to empty the bucket? 10 Litres 5 minutes
Note 6: Connecting tables, rules & graphs C = 2n + 30 36 = 2 x 3 + 30 32 34 38 40
Note 6: Connecting tables, rules & graphs C = 2n + 30 At time 0, the cost is $30. (y-intercept) When C = $41, n = 5.5 minutes
Note 6: Connecting tables, rules & graphs $ 0 $ 1.5 Does it make sense to extend the line below the x-axis? $ 4.5 $ 6.0 $ 7.5 Yes, it shows a loss if they sell less than 4 apples IWB Ex 18.03 pg 465
Note 7: Using Technology (Geogebra) To enable grid lines: Select View Click Grid Enter each rule into the Input space
Note 7: Using Technology (Geogebra) Your first line will appear! Double click on the line and select object properties to show the label or change the colour of your line
Note 7: Using Technology (Geogebra) Now our line shows the rule y=2x+1 beside it
Note 7: Using Technology (Geogebra) Now add the other lines into the input space
Note 7: Using Technology (Geogebra) Which one of these lines is different from the others? Why?
Note 7: Using Technology (Geogebra) Investigate these graphs the same way IWB Ex 18.02 pg 459
Note 8: Gradients The gradient of a line is a number that tells us how steep it is We measure gradients by describing how much the line rises for every 1 unit of sideways movement
Note 8: Gradients The gradient of a line is a number that tells us how steep it is This line has a gradient of 2 We can think of it as the fraction 2 1
Note 8: Gradients rise run rise run 1 1 rise run 2 3 What are the gradient of these lines? = = 1 =
1 1 2 1 Note 8: Gradients rise run 1 3 = 1 = 2
-2 1 -1 3 -2 2 Note 8: Negative Gradients rise run Write down the gradients of these lines = -2 1 4 = -1 BETA Ex 27.6 pg 371 Ex 27.7 pg 372
Note 9: y-intercept The y-intercept of a line is a number that tells us where it crosses the y-axis y=mx+c y-intercept gradient