Download
1 / 52
560 likes | 597 Views
Analytical Chemistry: Identification and Quantitation of Compounds in Complex Mixtures. The General Analytical Strategy Spectroscopic Methods Mass Spectrometry Sample Preparation Methods Quantitation Application to the Analysis of Flavonoids: Mass Spectrometry.

E N D
Analytical Chemistry: Identification and Quantitation of Compounds in Complex Mixtures • The General Analytical Strategy • Spectroscopic Methods • Mass Spectrometry • Sample Preparation Methods • Quantitation • Application to the Analysis of Flavonoids: Mass Spectrometry
Analytical Chemistry: Identification and Quantitation of Compounds in Complex Mixtures Example: Common Flavonoid Structures
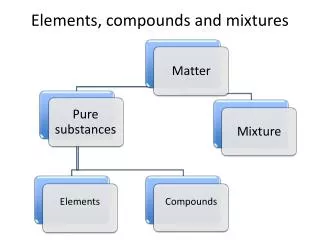
Common sugars found in flavonoid glycosides arabinose xylose galactose rhamnose glucose The complexity of the problem: Many flavonoids are glycosylated • Sugar linkage: O-glycosylflavonoids>>C-glycosylflavonoids • Positions of glycosylation: 3-OH>7-OH>>3’, 4’, or 5-positions • Level of glycosylation • Number of different sugars involved flavonoid aglycone
THE ANALYTICAL STRATEGY 1) Evaluate the problem: --pure component or mixture --solid, liquid or gas --organic, inorganic, elemental --sample size and number of samples --quantitative or qualitative analysis --type of matrix --requirements for accuracy and precision
Analytes of interest…. (a protein)
2) Select the appropriate method. • Select a sample preparation method: extraction? dilution? acid/base conditions? filtration? • If it is a mixture, select: • GC (Gas Chromatography) • HPLC (High Performance Liquid Chromatography) • CZE (Capillary Zone Electrophoresis) • For analysis, select: • Classical "wet chemistry" methods (titrimetry, gravimetry) • Electrochemical methods UV/Vis Molecular Absorption Spectroscopy • Infrared Absorption Spectroscopy Molecular Fluorescence Spectroscopy • Raman Scattering Spectroscopy Microscopy • Nuclear Magnetic Resonance X-Ray Spectroscopy • Electron Spectroscopy Atomic Spectroscopy • Mass Spectrometry
Analytical Strategy continued… 3) Characterize the method with reference compounds and standards. Run controls. Establish accuracy and precision for quantitative applications. 4) Construct a calibration curve and/or standard addition method or use internal standard for quantitative analysis. 5) Evaluate samples of interest. Repeat as necessary.
Molecular UV-Vis Absorption Absorption of UV or visible light causes “electronic transitions” in which electrons are excited to antibonding orbitals.
Absorption in Spectroscopy Electromagnetic Radiation Sample
UV-Vis Spectra of Four Flavonoids Rutin Quercetin glycoside Anthocyanidin Ploridzin Adapted from FEBS Letters, 401 (1997) 78-82, Paganga and Rice-Evans.
Beer’s Law: A = a b c = Absorbance where a = absorptivity in L/(g-cm) b = pathlength of radiation through sample in cm c = concentration of sample in g/L
Absorptivity: the probability that an analyte will absorb a particular wavelength of energy (also known as “extinction coefficient”) --range from 0 – 100,000 --units of L/(g-cm) or L/(mol-cm) --depends on presence of chromophores in the analytes
Absorbance concentration Absorbance Increasing concentration of analyte higher absorbance A = a b c Wavelength in nm
IR Absorption Formaldehyde Vibrational modes include stretching and bending (twisting, rocking, scissoring, wagging) Stretching: change in distance between atoms along interatomic axis Bending: change in angle between two bonds
Infrared Absorption Spectrum of Naringin aromatic C-O stretch C=O stretch OH Adapted from Sadtler Index, 1973.
(Hydroxyl protons not shown, from 9 - 13 ppm) Proton NMR Spectrum of Morin H6’ H3’ H8 or H6 H5’ H8 or H6 Adapted from Biochem. Pharm., 59 (1995) 537-543, Wu et al.
Electron Ionization: “EI” Common Ionization Method for GC-MS M = analyte e = electron F = fragment
77 207 208 193 131 105 89 179 165 152 Electron Ionization Mass Spectrum of Chalcone: Molecular Weight 208 amu Adapted from Rapid Commun. Mass Spectrom., 12 (1998) 139-143, Ardanaz et al.
ring electrode detector octapole ion guides heated capillary sample capillary ESI capillary sheath gas skimmer entrance end-cap exit end-cap Electrospray ionization for Larger, Involatile Molecules
411 455 (M + H)+ 515 393 231 m/z 200 300 400 500 Collisional Activated Dissociation of Protonated Nomilin 455 -- loss of CH3COOH 411 -- loss of CH3COOH and CO2
Solid-Phase Extraction Contaminants Compounds of Interest 2. Elute Compounds of Interest 1. Add Sample/Wash Contaminants
Gas chromatography for separation of volatile analytes in mixtures Capillary column Intensity Retention time
HPLC Apparatus: for involatile analytes in mixtures Regulated He Supply Pump Solvent Reservoirs Column Detector Injector Valve
C18 Stationary Phase C H H C 3 3 S i S i H C 3 S i i S H C 3 H C 3 S i
Typical Calibration Curves for Flavonoids Adapted from: FEBS Letters, 401 (1997) 78-82, Paganga and Rice-Evans.
Flavonoids in Kale: An LC-MS/MS Study quercetin (302) kaempferol (286)
supernatant N2 (l) Kale leaves kale powder 1:1 acetone vortex centrifuge powder 2:1 chloroform 1:1 30:70 acetone: water extract 1 aqueous phase collected separation filter • Kale extraction • Liquid extraction of flavonoids from kale Adapted from: Zhang, Satterfield, Brodbelt, Britz, Clevidence, Novotny Anal. Chem., 75 (2003) 6401-6407.
1 ml kale extract 1 mix 100°C 2h + kale extract 2 5 ml 2N HCl in 50:50 water:methanol condition kale extract 2 wash elute C18 cartridge kale extract 3 (final) Kale extraction (cont’d) • Acid hydrolysis for cleaving flavonoid glycosides to their aglycone forms • Solid phase extraction for cleanup and concentration LC-MS/MS analysis
Flavonoid separation by HPLC • Guard column: Waters Symmetry C18, 2.110 mm, 3.5 m • Analytical column: Waters Symmetry C18, 2.150 mm, 3.5 m • Mobile phase: Solvent A-water, solvent B-acetonitrile. 0-13 min: 30-100 B; 13-15 min: 100-30 B; 15-25 min: 30 B
Identification of flavonoids by ESI-MS/MS: CAD spectrum of quercetin 179: - C7H6O2 100 80 151: - C7H6O2 – CO 60 C15H10O7 Mw=302 Relative Abundance 40 273: - CO 20 257: - CO2 301 (M - H+) 107: C7H6O2 - CO - CO2 193 229 239 0 100 140 180 220 260 300 340 m/z
Calibration curves of flavonoids by LCMS Kaempferol y = 0.0635x + 0.0876 R2 = 0.9972 Quercetin y = 0.0556x + 0.199 R2 = 0.9785 Linear concentrationrange: 0.03-90 g/ml Detection limit by HPLC-ESI-MS: quercetin-~10 pg; kaempferol-~3 pg
0.040 int. std. 0.030 quercetin AU 0.020 kaempferol 0.010 0.000 4.00 8.00 16.00 20.00 24.00 12.00 Minutes Analysis of kale samples by LCMS A. HPLC-UV chromatogram B. TIC-MS chromatogram 100 int. std. 80 60 Relative Abundance 40 Quercetin in kale: 77 ppm Kaempferol in kale: 235 ppm Recovery: ~65% kaempferol quercetin 20 0 0 4 8 12 16 20 24 Time (min) Adapted from: Zhang, Satterfield, Brodbelt, Britz, Clevidence, Novotny Anal. Chem., 75 (2003) 6401-6407.
Flavonoids in Grapefruit: Monitoring metabolites by LC-MS/MS • Identification of metabolites • Pharmacokinetics • Bioavailability
Analysis of urine by LCMS after consumption of grapefruit juice 100 Urine at t = 7.5 h RT: 6.4 m/z 447 RT: 5.6 m/z: 447 RT: 9.7 m/z: 253 Relative Abundance RT: 10.7 m/z: 351 0 Time (minutes) Zhang and Brodbelt, The Analyst., 129 (2004) 1227-1233.