1 / 1

Understanding Stem-and-Leaf Diagrams: A Visual Representation of Data

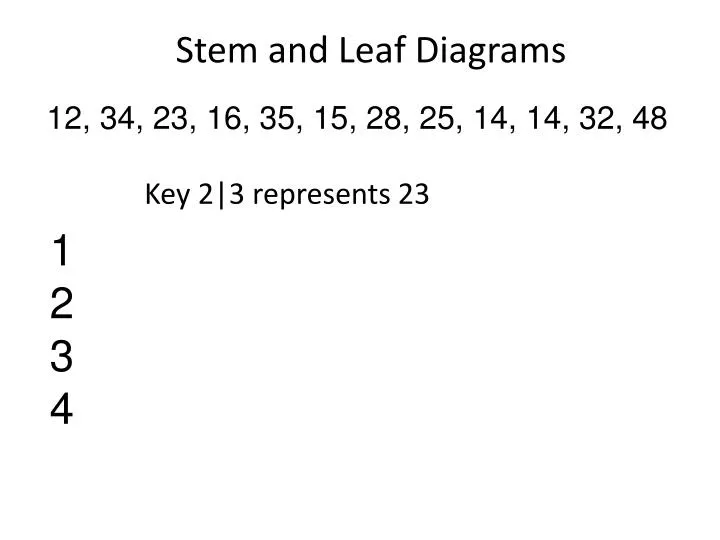
Learn how stem-and-leaf diagrams simplify data visualization by grouping similar values together, aiding in statistical analysis and interpretation.

Download Presentation

Understanding Stem-and-Leaf Diagrams: A Visual Representation of Data

An Image/Link below is provided (as is) to download presentation Download Policy: Content on the Website is provided to you AS IS for your information and personal use and may not be sold / licensed / shared on other websites without getting consent from its author. Content is provided to you AS IS for your information and personal use only. Download presentation by click this link. While downloading, if for some reason you are not able to download a presentation, the publisher may have deleted the file from their server. During download, if you can't get a presentation, the file might be deleted by the publisher.

E N D

Presentation Transcript


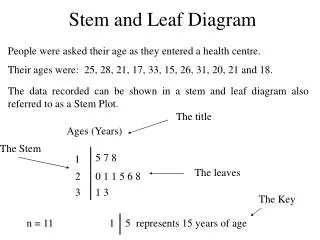
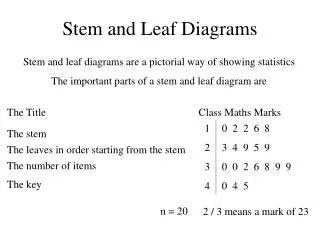
  1. Stem and Leaf Diagrams Key 2|3 represents 23 1 2 3 4 12, 34, 23, 16, 35, 15, 28, 25, 14, 14, 32, 48

More Related