Download
1 / 40
410 likes | 573 Views
STEM AND LEAF DIAGRAMS. Don’t forget to order Include a key. STANDARD FORM. It’s a number between 1 and 10 times by a power of 10. e.g. 450 is 4.5 x 10 2 Use the exp button on the calculator. POWERS. When multiplying times the numbers and add the powers

E N D
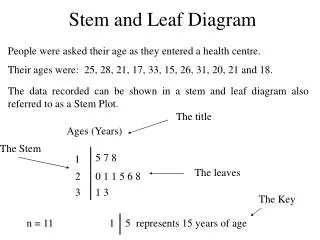
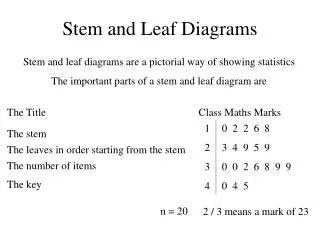
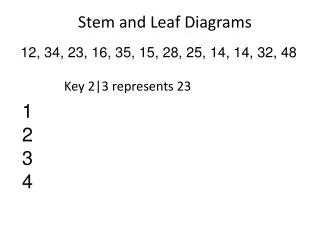
STEM AND LEAF DIAGRAMS • Don’t forget to order • Include a key
STANDARD FORM It’s a number between 1 and 10 times by a power of 10. e.g. 450 is 4.5 x 10² Use the exp button on the calculator
POWERS • When multiplying times the numbers and add the powers • When dividing divide the numbers and take away the powers • Power of 0 is 1 • Fraction powers: ½ is square root, 1/3 is cube root
FRACTIONS OF • Fraction of – divide by the bottom, times by the top.
COORDINATES • For 3d coordinates follow the axes as x,y,z • To find midpoints add the x’s then halve. Do the same for the y’s and z’s.
ANGLES • Parallel lines- look for FUZ: Corresponding Interior Alternate • Bearings measure clockwise from North
LCM and HCF • LCM is a multiple, so is bigger than the start numbers • HCF is a factor, so is smaller than the start numbers
AREA • Rectangle is length x width • Triangle is height x base / 2 • Trapezium is (add parallel sides) x height /2 • Compound shapes – split into easier shapes then add together • Circle is pi x radius squared
VOLUME • Prisms – Area of front x length
EXPANDING BRACKETS • Two brackets together – eyebrows and smiley face are 4 multiplies
FACTORISING BRACKETS • Pick the x’s to times together • Pick the numbers to times to the question • Check the smiley face to see if the x term is right
STRAIGHT LINES • Form is y=mx+c • To plot the line, take 3 x values and find out the y values that go with them
CIRCLE ANGLES The angle between a tangent and a radius is 90o
SCATTER DIAGRAMS • Plot the points • Line of best fit • Positive and negative correlation
SIMPLE PROBABILITY • Probabilities add to 1 • Multiply the probability by the number of times
MEAN FROM A TABLE • Multiply frequency by the value • Divide this total by total frequency
QUESTIONNAIRES • Look for a time limit in the question • Overlap between the choices • Any missing choices?
BOX PLOTS • Plot 5 measures to draw it • To compare, 1 comment on the median, 1 comment on the interquartile range (the width of the box)
CUMULATIVE FREQUENCY • Running total • Plot end points against cumulative frequency • Measure median and quartiles
ESTIMATE OF THE MEAN • 2 extra columns • Use mid point of groups • Mid point x frequency • Big total divided by little total
HISTOGRAMS • Frequency density is freq divided by class width • The area of a bar is the frequency
PERCENTAGES • 1% - divide by 100 • 10% - divide by 10 • % change is change / original x 100%
STRAIGHT LINES • Look at the gradient – positive or neg • Gradient is up divided by the across • Line is y=mx+c, where m is the gradient and c the intercept
CALCULATOR WORK • Work out the top • Work out the bottom • Top divided by the bottom
RATIO • RATIO 2:3 MEANS 2+3 = 5 PARTS • FIND THE VALUE OF 1 PART
PYTHAGORAS • TAKE THE 2 NUMBERS • SQUARE • SQUARE • ADD OR SUBTRACT • SQUARE ROOT
TREE DIAGRAMS • Each V adds to 1 • Multiply alon g the branches
TRAVEL GRAPH Away from home Journey home Stops Distance Speed Time
POLYGON ANGLES Interior angle is 180 – exterior angle
INEQUALITIES 3 included, filled circle -2 not included, empty circle • Integer means whole number • Solve like an equation
ENLARGEMENT Scale factor x3 Count across and up from the centre Times this by 3 from the centre Negative enlargement goes the opposite way
BEST VALUE Change £ into pence by x 100 Work out the cost of each per unit Show all your working out State the answer at the end
FRACTIONS Top of 2nd Bottom of 2nd • + TR+BL • BR • TR – BL • BR • X TL • BR • ÷ TR • BL Top of 1st fraction Bottom of 1st fraction Works for algebra fractions too
FORM AND SOLVE EQUATION • This one is about angles, so add algebra together and put equal to 360. • If perimeter, do the same but put = perimeter. • Solve by simplifying and solving
VECTORS • Go from A to B • Only use a and b • -a+bor b-a
PLOTTING GRAPHS • Complete table of values • Plot points on grid • Join points together to make a graph
PROPORTION • Get 1 by dividing • In this case 1cm = 17.8 / 160 • Multiply by his new number eg 210 x
TRIG • Right angle triangle • Label sides • Pick correct triangle • Cover up the side you want • If finding angle use the 2ndF button Write SOHCAHTOA on the formula page of the paper
CONES AND SPHERES Everything you need to know is on the formula sheet on the paper