Download
1 / 87
870 likes | 888 Views
This document provides a summary of the VIIRS instrument calibration and characterization support team meeting held in May 2008. It includes a list of test data, analysis reports, technical memos, and details on the radiometric calibration objectives and results for thermal emissive bands, reflective solar bands, DNB, and dual gain transitions. It also discusses response versus scan-angle characterization and issues related to SIS monitor stability and uncertainties.

E N D
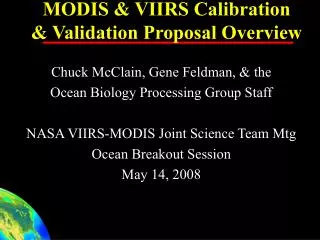
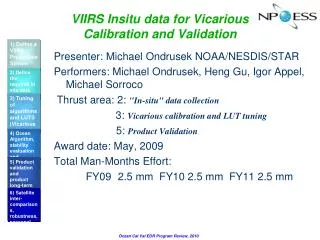
VIIRS FU-1 Pre-launch Calibration and Characterization NPP Instrument Calibration Support Team/Element (NICST/E) VIIRS/MODIS Science Teams Meeting Hilton BWI Airport May 15, 2008
References • List of Ambient Phase I, II, and III Test Data • Test IDs and Names; Data Collected/Processed • List of NICST Data Analysis Reports • Name: NICST_REPORT_YR_###q (q for quick report) • Subject and Date Released • List of NICST Technical Memos • Name: NICST_MEMO_YR_### • Subject and Date Released • All NICST reports and memos are available from e-room
VIIRS Ambient Radiometric Calibration and Characterization (RC-01) Objectives: characterize sensor radiometric response/gain, dynamic range, SNR/NEdT, and dual gain transition RC-01 Part 1 for Thermal Emissive Bands RC-01Part 2 for Reflective Solar Bands RC-01Part 3 for DNB RC-01Part 4 for Dual Gain Transitions STR-504, 506, and 508
Radiometric Calibration Summary (RC-01) • All detectors meet the SNR/NEdT requirements (specified at typical radiance/temperature) • M12 D1 is out-of-family (OOF) • Most spectral bands meet the dynamic range requirements • Exceptions: M8 (HG), M1 (LG), and M2 (LG) • Most dual gain bands meet the gain switching requirements • Exception: M1 (HG to LG) RC-1 provides initial ambient baseline performance information RC-2 and RC-5 in TVAC will provide final verification of sensor performance
RSB Gains and SNR Measured SNR for all VIIRS RSB bands meet the specified requirements at Ltyp (Expected values from Y23503; SBRS gains from Y23579)
TEB Gains and NEdT Run 2 CFPA set at 79.2K Run 3 CFPA set at 81.6K A few detectors failed SNR/NEdT in run3 (det. 2, 9, 16 of M14; det. 8 of M16A)
OOF Detector: M12 D1 Detector 1 is OOF. But meets the spec.
from Y23656 Dynamic Range Compliance HAM A ASP A SRV0465: RSB Dual Gain Band's High/Low gain transition within +20.0% to 0.0% of spec. SRV0468: TEB Dual Gain Band's High/Low gain transition within +5.0K to 0.0K of spec. (M13: 343-348K)
M8 Did Not Meet Dynamic Range Requirement Saturated before the specified maximum radiance Noticeable detector response variation After ASP gain adjustment, M8 still failed dynamic range requirement (RC1 RUN2 and STR-508)
Concerns (Ambient RC-01) • SIS100 stability impact on radiometric calibration • IFA filter leak: red leakage through M1 filter could be 16% of M1 RC-1 signal, causing the gain to be over estimated (from NGST) • SWIR bands M8, M9 and M11 had relatively large detector gain variations • Most dual gain bands had large noisy behavior at their gain transitions (to be verified from new test) • Path forward: Better characterize SIS monitor and make sure it works RC-1 provides initial ambient baseline performance information RC-2 and RC-5 in TVAC will provide final verification of sensor performance
Response Versus Scan-angle (RVS) Characterization (FP-10) Objectives: characterize RSB response versus scan angles (RVS); characterize TEB response versus scan angles (RVS) FP-10 Part 1 for RSB FP-10 Part 2 for TEB
RVS Characterization Summary (FP-10) • RSB RVS characterization meet the requirements (agree with SBRS results) • TEB RVS characterization meet the requirements (agree with SBRS results) PVP 4.2.2.4.2 Characterize normalized RVS of RSB bands over full earth view scan to 0.3% or better (Pre-launch: 0.27%; change over life: 0.1%). PVP 4.2.2.4.3 Characterize normalized RVS of TEB bands over full earth view scan to 0.2% (0.6% for M14) or better (Pre-launch 0.17% (0.57% for M14); change over life: 0.1%).
RVS Data Collection • FP-10 Part 1 • RSB bands: 12 discrete scan angles: -65.4o, -55.5o, -51o, -45o, -38o, -30o, -20o, -8o, 6o, 22o, 38o, 55.5o. • SIS100 radiance monitor data collected • Relative humidity and temperature monitored • FP-10 Part 2 • TEB bands: 12 distinct scan angles: -65.7o, -60.6, -55.5o, -51o, -45o, -38o, -30o, -20o, -8o, 6o, 22o, 35o • CFPA controlled using BTC • LABB and OBC BB data collected
RSB RVS (for all detectors) RVS results agree well to within 0.1%
RSB and TEB RVS Uncertainty RVS uncertainty included (1) fitting residuals (2) measurement errors Both RSB and TEB RVS characterization meet the requirements (consistent with SBRS analyses and results)
RVS Results and Issues • SIS monitor approach was not satisfactory • SIS stability and uncertainty are major concerns • Drifting correction approach works better for RSB RVS retrieval • Results agree well with SBRS using the same approach • Better understanding of SIS drifting mechanism and correction methodology needed • Uncertainties of RSB and TEB RVS meet the requirements. • HAM side difference is ~0.6% for M6-M7 and I2; ~0.4% for TEB bands • Detector variation < 0.1% for RSB; and <0.4% for TEB • Path forward: • FU1: verify RSB RVS with witness samples; re-evaluate TEB RVS uncertainty assessment • FU2: repeat measurements should be made at multiple scan angles.
Drift corrected Measured SIS monitor correction vs drifting correction SIS corrected Group 1 Group 2Group 3
FU1 VIIRS Polarization Insensitivity for VisNIR BandsFP-11, STR-545, and STR-554 • Test Objectives • Examine the insensitivity of the sensor to an input polarized light • Measure polarization insensitivity for every VISNIR band and detector at discrete scan positions • Characterize polarization insensitivity to uncertainty level (0.5%) specified in TP154640-103 • Spec. for polarization factor:3% for M1 and M7; 2.5% for all other VisNIR bands
Data Analysis Status of Polarization Insensitivity for VisNIR Bands • Tests using PSA as polarized light source • Data: run1 and run 2 • Data analyzed and polarization parameters derived • Strong effect of non-uniformity of light source and other noises • Algorithms developed to correct the effect of the PSA but they still depend on how well the PSA is characterized • Tests using SIS with a polarizer sheet as polarized light source • Data: run2-STR-545 and run3-STR-554 • Data analyzed and polarization parameters derived • No non-uniformity of the light source issue • The polarizer sheet might not provide perfect polarized light, waiting for SBRS’ investigation
Algorithms for Polarization Insensitivity Data Analysis • Fourier Analysis • a is the polarization angle • Oscillation • Only second order oscillation has information for the polarization effect • Other order oscillations • due to light source and other noise
Detectors:5-16 Measured Response PSA SIS with polarizer sheet
Amplitude of One-cycle Oscillation PSA SIS with polarizer sheet
Polarization Factor PSA SIS with polarizer sheet Uncertainty is definitely larger than 0.5%
Polarization Factor SIS with polarizer sheet Polarization factors of band M1 (412 nm) are smaller than of band M2 (445 nm). This is probably due to the non-fully polarization of light for band M1, an issue being currently investigated by SBRS.
Polarization Factor SIS with polarizer sheet For band I1 (640 nm), the polarization factors are quite different for the two mirror sides at small AOI. The differences between the two mirror sides also observed for polarization factors of bands M4 (555 nm) and M5 (670 nm). This phenomena were also observed in the polarization factors derived from the tests using the PSA to provide polarized light source.
Polarization Factor SIS with polarizer sheet HAM B HAM A Detector averaged polarization factor
Summary • All FU1 VIIRS polarization insensitivity test data (both with FP-11 and SIS with a polarizer sheet as light source) for VisNIR Bands are analyzed and the polarization parameters are derived from the measured data. • The derived polarization factors from all tests satisfy the VIIRS specification for the polarization factor. • The derived polarization factors are sensitive to detectors and also mirror side for a couple of bands. • The polarization parameters derived from the test using PSA to provide polarized light are significantly contaminated by effect of non-uniformity of the light source and other noise. The uncertainty of the derived polarization factors are larger than the specification for the uncertainty level. • The light provided by the SIS with a polarizer sheet might not be a fully polarized light. But the effect of the non-perfect polarized light on the derived parameters need to be corrected. The uncertainty level of the derived polarization factors can not be assessed without the characterization of the polarization degree of the polarizer sheets used in the tests.
FP-12: RSB Stray-Light Rejection (SLR) • The irradiance from earth and/or cloud albedo outside the sensor FOV will be the main source of stray light, and sensor rejection of this light should be demonstrated prior to launch • FP-12 test simulated stray light source comparable to the on orbit condition • Test data was used for evaluation of temporal SLR performance against the specification • The original specification SRV0065 requires that stray light causes less than 1% change in response when sensor viewing an earth scene of typical radiance
FU1 FP-12 Lamp Positions (Run 2) 120 80 40 X (in) 0 -40 -80 -120 -120 -100 -80 -60 -40 -20 0 20 40 60 80 100 120 Y (in) FP-12 Lamp Position at Nadir • A 1000w studio lamp was placed 120in away to provide uniform illumination over a solid angle cone • Telescope was locked at three different scan angles: EOS (w/ cooled CFPA), Nadir (w/o BTC) and SV • At each scan angle, the ABC was aligned with sensor FOV to provide a dark view • At each lamp position, the measurement was done with the lamp off, on and off • Sensor responses from all positions were summed and scaled to compensate for the spectral difference between earth albedo and the lamp. The lamp was placed behind ABC
Summary of FP-12 Results • After the initial run, the test data indicated that most of M-bands did not meet the original requirement, and an EFR was generated to formally track the non-compliance results • The run 2 results show that bands M2-M7, and M11 do not meet the original requirement, but meet the proposed requirement RDW053A • Path Forward: evaluation and approval of waiver request
Waiver of SRV0065 –W053 • It is said that based on heritage mirror roughness knowledge, the predicted results showed non-compliance for VisNIR. • For M8, M9 and M11, the SLR requirement makes SNR at Ltyp more stringent than the sensor SNR specification. • Previous RDWs w053 was based on the initial modeling, a less matures models. RDWs w053A was proposed
Ratio of proposed to the original requirement Ratio of scattered radiance to the original requirement M11 has the largest scattering response Preliminary Results • Ratio stands scattered radiance to the original spec. • Bands with the ratio >1.0 are non-compliant
Summary of Near Field Response (NFR) • FP-14 test was conducted with a single vertical slit scanning across IFA w/wo ND, and bandpass filters were used for VisNIR • The objective is to estimate the ability of the sensor to measure the radiance from one region the earth scene which differs from the adjacent regions. An example - a bright cloud scanned by the sensor might introduce scattered radiation that would corrupt the radiometric measurements of an adjoining dark region • The processed test data w/ selected collects are the same as the Raytheon • The preliminary results of the data analysis indicate that at least bands M4, M12, M13 and M16 are non-compliant • The largest margin between the existing specification and the measured data is found in TEB band M12 > 750% • Ghosting signals are found in TEB which makes it difficult to assess the NFR.
FP-14 Test Overview • FP-14 – NFR for all spectral bands Dynamic crosstalk artifacts are found in many VisNIR collected without BPF. Ghosting artifacts are found in TEB • STR541 – Emissive Band Filtering An extended test for TEB to use bandpass filter to generate a narrow width light. Unfortunately, the artifacts were still presented, though the SNR was improved. The second run was conducted with the lamp level as high as possible to maximize SNR. This data is used in the FP-14 analysis. • STR546 – Aperture Blocking To confirm the source of artifacts was within VIIRS and not a result of the test setting. Measurements were made with the aperture open, left half blocked, right half blocked and fully blocked. Unfortunately the results didn’t give a sufficient explanation. • STR547 – TMC Source with Slit & Single Point Reticles To confirm that the ScMA was not the source of the artifacts. The results still exhibited the artifacts. Requested by Eric Johnson, a few sets of data were collected with the single point reticle positioned over detectors 2, 8, 9 & 13 individually. The data allows to derive a more representative PSF to generate a scan & track response for the ScMA data. NGST used this data alone with FP-14 to derived ghost coefficients. • EFR3326 Engineering Failure Report 3326 was opened to track the investigation of artifacts in the FP-14 data.
Ghosting signal Margin: 750% Initial spec. limits 0.1% of scattered response onto a detector from a bright target at 3 millirad away Ghosting signal in STR-541 • Artifact signal of ~0.2% (FP-14: 0.5%) is seen on the detector when the slit is scanned across the IFA • Artifact is angularly dependent in scan direction • Ghosting is confirmed from the Dewar by a 2D-modeling Scattered response: dn/dn_max Ø: angular distance in degree The ghosting is observed in bands M12-M13, and M15-M16
M13 Analyzed Result (Preliminary) • Two sets of test data, one saturated and one unsaturated, are stitched together to generate the relative response for each detector. • The stitched data are used to verify and refine NFR H-S models, which are used to evaluate the sensor performance.
New columns Waiver w004 • It is said that requirement is too stringent for a few bands, since the large contrast ratio between Lmax and Ltyp never occur in the same earth scene. • New requirements is under developing. To date no mutually agreeable changes have ever been identified.
NGST EFR 3326 InvestigationGhosting impact on SDR • ERF 3326 Conclusions • Root cause is known-reflection and rejected light comes from Dewar window • NGST SDR sesults suggest no substantial impact in Emissive band SDR SST • NGST impact on assessment of EDRs VIIRS Cloud Mask and Aerosols are in progress • Path Forward • NGST investigate VIIRS Cloud Mask and Aerosols EDR • Need independent verification of artifact Ghosting is a small impact to SST EDR
FP13 Crosstalk Measure the crosstalk signal under both static and dynamically scanning conditions Part 1 uses the Three Mirror Collimator (TMC) and Part 2 uses the Scatter Measurement Assembly (ScMA) to cover the low gain region of the VisNIR dual gain bands. Include both polychromatic illuminations Verify compliance with crosstalk requirements for all spectral bands. STR Crosstalk FPA and In-band crosstalk: STR351, STR352, STR358, STR359, STR405 and STR406 Crosstalk survey tests to investigate the presents xtalk artificial after rework of ASPs and VNIR FPA Provided preliminary assessment of crosstalk mechanisms Optical Crosstalk/Filter Leakage for VisNIR In-band dynamic xtalk for all spectral bands VIIRS FU1 Crosstalk
Analyzed Data Checklist • Completed STR351, STR352, STR358, STR359, and STR406 crosstalk analysis • Completed FP-13 point-to-point static and dynamic crosstalk analysis for all spectral bands • Identified crosstalk root cause, as well as the major send detectors • Derived and delivered static point-to-point crosstalk influence coefficients for all VIIRS spectral bands in dn, radiance, and CNR spaces for cases of: • For HG --> HG • For LG --> HG • Fixed LG --> Fixed LG • Results comparison between similar tests are in progress
Summary of STR Optical Crosstalk • Significant optical crosstalk is evident from • M1, M3 and I1 into M4 • M4 into M5 • High optical crosstalk is associated with TMC BPF blocking sides, as well as IFA filter leak • Filter orientation recommendation for FP-13 after STR-406 was made by NGST on Sept 26, 2007 • Optical crosstalk/leak is measurable for receiver bands M1, M2, M4, M5 and M6 at difference spectral ranges • M1: 770-830nm • M2: 370-390nm • M4: 428-432, 460-470 and 700-720 nm • M5: 460-470, 570-585, and 770-830nm • M6: 370-390, 460-470, 500-520nm • Compared with STR-443 data (component level), STR-406 (system level) shows improvement in spectral range >700nm • Optical crosstalk map was derived and released
Static Slit 972 mrad Filter used UAID Collects No filter 8 3101194 33101195 OOB filter (382.45 nm) 8 M1 BP filter 8 3101196 3101197 OOB filter (430.54 nm) 8 M3 BP filter 8 3101198 OOB filter (466.94 nm) 8 3101199 88 M4 BP filter 3101200 OOB filter (511.86 nm) 8 3101201 3101202 I1 BP filter 8 OOB filter (579.05 nm) 8 3101203 3101204 M5 BP filter 8 M6 M5 M7 I2 I1 M4 M3 M2 M1 OOB filter (711.62 nm) 8 3101205 3101206 M6 BP filter 8 OOB filter (802.85 nm) 8 3101207 3101208 I2/M7 BP filter 8 OOB filter (955.58 nm) 8 3101209 381 mrad 930 mrad STR 406 Optical Crosstalk Overview Scanned Slit xxx xxx xxx xxx xxx xxx xxx xxx • Objective: Evaluate optical leakage through VisNIR IFA • slit illumination using The TMC • 8 OOB spectral filters and 7 VisNIR BPF were used • ~972 microradian slit width (approx 2.5 M-Band IFOV) • TMC SIS is at 23,000 (max)
The crosstalk influence coefficient is in radiance space FU1 Optical Crosstalk
X Dynamic Crosstalk Tests • Dynamically scanned • 256 scans each collect • STR w/ KE Reticle • STR358: vertical KE for VNIR • STR405: vertical KE for • SMWIR & LWIR • STR352: horizontal KE • Illumination of lower number detectors • Obscuration of higher number detectors • 6 track positions of horizontal knife edge Single Slit ReticleTR359: 5 TMC BB Levels for SMWIR and LWIR, 9 BP filters: M8, M9, M10/I3, M12, M13, M14, I4 and I5;STR351: 5 TMC SIS Levels, 7 VNIR BP filters: M1, M3, M4-M7/I2, and I1 FP-13: three TMC SIS source levels 4000, 4500, and 25000 flFP-13 w/ Open Reticle Highest TMC source level for VisNIR bands Horizontal Knife Edge Vertical KE Orientations Single vertical slit
Preliminary Summary of Dynamic Crosstalk Generally in radiance space: • Improvement is made in dynamic crosstalk in FU1 compared with EDU data after bond wire additions • Dynamic crosstalk are observed only in VisNIR when sender bands are M4, M5, I1, and I2/M7 • Dynamic crosstalk in radiance space is impacted by gain state. Low gain has smaller coefficients. • Dynamic crosstalk is proportional/linear to the source level • Detector variations and I-band sub-sample difference are measurable