Download
1 / 38
380 likes | 513 Views
The 10-Year Remote Sensing Industry Forecast. TRB Conference December 12, 2001 Jim Plasker Executive Director, ASPRS. ASPRS. American Society for Photogrammetry and Remote Sensing

E N D
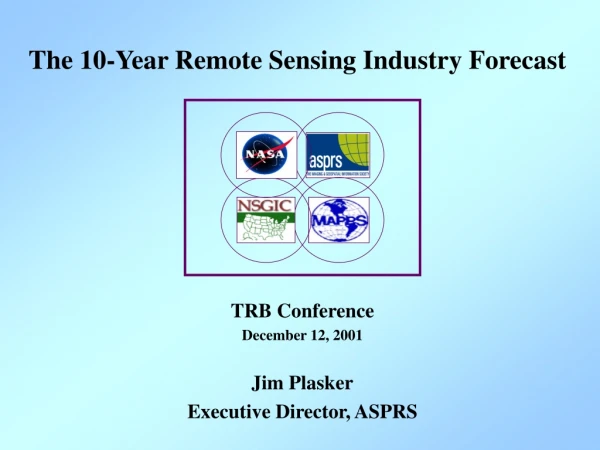
The 10-Year Remote Sensing Industry Forecast TRB Conference December 12, 2001 Jim Plasker Executive Director, ASPRS
ASPRS • American Society for Photogrammetry and Remote Sensing • Mission: “…advance knowledge and improve understanding of mapping sciences and to promote the responsible applications of photogrammetry, remote sensing, geographic information systems (GIS), and supporting technologies.” • Membership: approximately 7000 equally split among government, academia and commercial sectors
10-Year Remote Sensing Industry Forecast Topics • Background • Review Phase I - Industry Baseline • Phase II - User Needs/Requirements • (Very) Preliminary Survey Results
Background • In August 1999, ASPRS and NASA's Commercial Remote Sensing Program (CRSP) entered into a 5-year Space Act Agreement (SAA), combining resources and expertise to: • Baseline the Remote Sensing Industry (RSI) • Develop a 10-Year RSI market forecast • Provide improved information for decision makers • Develop attendant processes
Forecast Participants • Space Imaging • Kodak • SPOT • EarthData • PAR • Autometrics • Spencer-Gross • American Forests • RAND • Pictometry • Leading Edge • Lockheed Martin • Geomatics • Eaglescan • Landcare Avn. • University of Arizona • University of Utah • University of Missouri • RIT • University of Southern • Mississippi • NASA • NOAA • USGS • ASPRS • NSGIC • MAPPS
Remote Sensing Industry Definition Platforms & Sensors Data Collection Phase I Data Processing Support Elements Industry Intermediaries • Hardware • Software • Etc. • VARs • Consultants • Etc. Business Segments End-User Phase II
Interview Survey Forecast $ $ Time Findings 17% Literature Search Focus Group 20% Conclusions 21% 21% 21% Forecast Process ANALYSIS
Forecast Plan Phase I Characterization and Baseline Forecast of the Industry (Dec 2000) Phase II Characterization of Customers/Users and Determination of Their Needs/Requirements (Jan 2002) Phase IIIValidate I and II (Dec 2003) Technology Assessment Phase IVMarket Forecast (Dec 2004) Project Plan
Data Collection to Date • Phase I • Interviews: 36 (Commercial CEO level) • Web Surveys: 437 (Commercial, Government, Academia) • Closed Envelope Revenue Survey: 43 (Commercial, CEO/CFO level) • Phase II • Interviews 134 (Managers, Users, SLT Government) • Focus Groups 4 (NSGIC, Local GIS, ASPRS/MAPPS, URISA) • Web Surveys > 700+ and counting • Closed EnvelopeRevenue Survey: Ongoing (Commercial, Senior level)
Topics • Review Phase I - Industry Baseline • Results • Phase II - User Needs/Requirements • Preliminary Survey Results
CRSI Sales 1998 to 2010 Forecast Baseline Based on calculating the average real annual growth rate from 1998-2000 (respondent estimates) and applying that rate to the out-years Projected Actual
Market Segment as % of Sales CY 2000 National/Global Security 41% Mapping 17% Civil Government 15% Transportation 9% 4% Environmental Utilities 4% Agriculture 2% Exploration/Resources 2% Forestry 2% Telecommunications 2% Entertainment/Media <1% <1% Insurance Real Estate <1% Other <1% % of Sales
Aerial Space Primary Platform Use CY 2000
CEO Interview Findings Selected Barriers to Growth • Technology: Innovations needed to... • Speed availability of information (vs. data) • Provide information valued by user • Develop systems that integrate data and provide multi-disciplinary solutions • Lower costs • Workforce education • Demand for entry-level personnel exceeds supply • Insufficient Level of Customer RS Knowledge • Applications based Marketing and Demonstrations may help
Topics • Review Phase I - Industry Baseline • Results • Phase II - User Needs/Requirements • Preliminary Survey Results
Planned Cross-cut Analyses Demographics • Sectors • Commercial • Academia • Government • Federal Vs. SLT (Local) • Users Vs. Managers • Tool Used Vs. Tools Needed • Research & Development • Education Levels • Training Rates Characteristics • Imagery Types • Accuracy/Resolution • Timeliness • Applications/Market Segments • Collection Means • Coverage • Data Layers • Sources/Providers
Respondents by Sector 708 Completed responses Government Sector respondents make up nearly half of the sample
Government Sub-Sector of Employment Fed: 35% Local: 35% Number of Responses SLT: 60% Sub-Sector
Use/Plan To Use Remote Sensing Data/Information/Software • Estimated short term growth: 8.0% • Data: 9.3% • Information: 8.0% • Software: 6.5% • >700 Respondents, providing 1600 Responses • The majority of Respondents identified at least two categories • Data and Information are used more than Software
Manager Vs. User Perspective • Fairly balanced perspective • 75% Users • 81% Managers • Also balanced by sectors
Educational Levels Number of Responses Well educated workforce vs. Lack of adequately developed workforce – a numbers issue!
Degrees by Discipline • Top “Instructor” disciplines per Phase I: Geography, Forestry, Civil Engineering, Photogrammetry, Geology, Environmental Science • Not a bad fit! • 60% have had course work related to remote sensing
Application Areas in which Respondents Work • Phase I Most Active Markets: • Mapping/Geography • Environment • Civil Government • National/Global Security • Transportation Where is the Growth Potential?
Meeting Application Area Needs 22% 49% 28% Number of Responses Application Areas • In general, half of the user needs are being fairly well met, but a significant number (28%) are poorly met • This is generally true across all sectors
Importance of RS Data/Information Characteristics Interview Results • Users of data/information collected from both Aerial and Space Platforms agree that Spatial Resolution and Geolocation Accuracy are the most important characteristics • Cost is an important characteristic but not most important. However, from the surveys it appears that cost is a major driver for Manager-Users who purchase the data/information
Elevation Accuracy: Use Vs. Need There is an indicated need for increased elevation accuracy
Elevation Accuracy: Government Number of Responses Level of Elevation Accuracy
Elevation Accuracy: Government Number of Responses Level of Elevation Accuracy There appears to be a decided need for increased elevation accuracy in the Government Sector ~ 3m
Horizontal Accuracy Number of Responses Level of Geo-location Accuracy
Horizontal Accuracy Number of Responses Level of Geo-location Accuracy Pending further analysis, it appears that there is a general need for improved geo-location accuracy of 1meter or better
Spatial Resolution Pending further analysis, it appears that there is a need for higher spatial resolution of less than 1 meter.
Timeliness Requirements • Timeliness requirements tend to cluster. • Government Sector has more interest in Real Time than other Sectors • Nearly 60% of Commercial Sector interest clusters between 1-3 Days and 1-3 Months
Use of Imagery • Largest increases in use: • Hyperspectral • LIDAR • Digital Color • Digital B/W • Color IR Film • Aerial Imagery is used 65% of the time. • Multi-spectral imagery is the most used type of imagery collected by space platforms • Digital is the most used imagery format
Conclusions • The CRSI market is growing at about 13% per year (Effects of 9/11/01?) • About $2B in 2001, growing to about $6B in 2010 (Constant CY 2000 $) • Aerial and Satellite markets do not seem to be in competition • The CRSI is fragmented and populated with lots of small companies • Does not necessarily mean low entry barriers. • Imagery collected from Aerial Platforms is used twice as frequently compared to imagery collected from Space Platforms • High Resolution, Geo-location Accuracy and Cost are market drivers; however, information value/content has a strong influence and can overcome cost issues
Conclusions (Continued) • Digital is the preferred format • Companies typically operate in more than one business segment • Government agencies are the largest potential Customer group (about two-thirds of revenues through 2006 are F/S)
Conclusions (Continued) • In all Sectors, the barriers to growth appear to be funding, education, training, and awareness; not available technology. • Currently, across all Sectors, the most Active Applications or Market Segments are: • Mapping/Geography • Environment • Civil Government • National/Global Security • Transportation
For More Information Slides available at: http://www.asprs.org/asprs/news/forecast_frame.html or http://www.asprs.org News & External Affairs Email the Project Team: Forecast@asprs.org