Download
1 / 41
410 likes | 420 Views
Learn about binomial probability models and distributions in common scenarios like coin tossing, free-throw success, and color blindness. Explore formulas, examples, and practical applications.

E N D
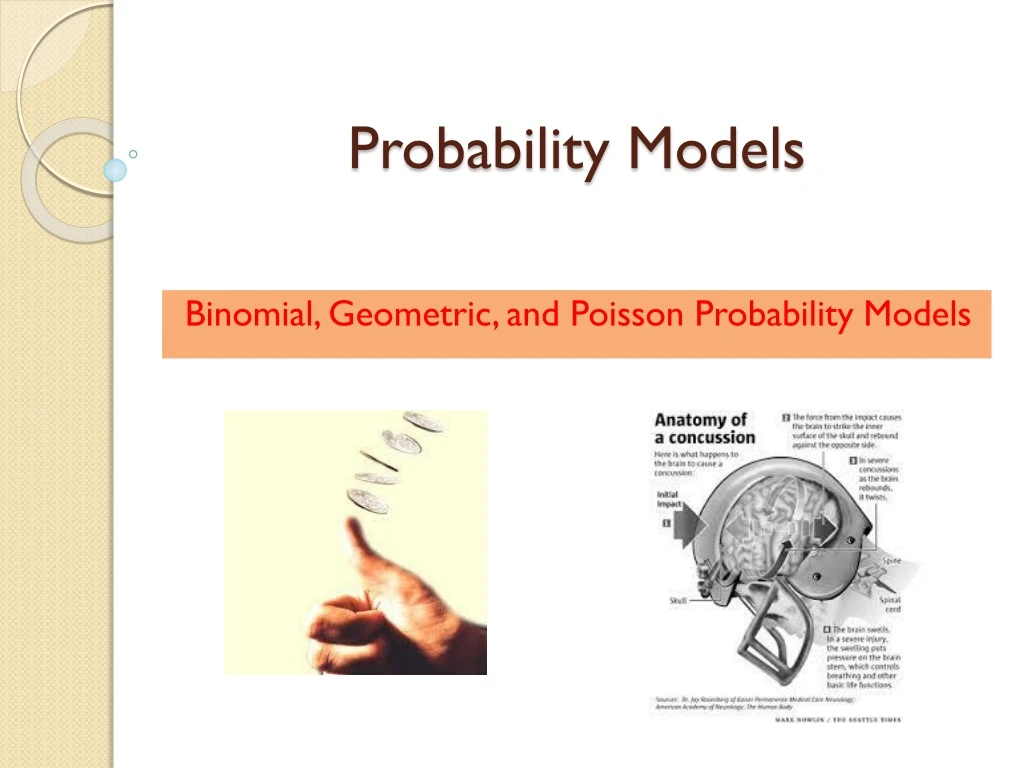
Probability Models Binomial, Geometric, and Poisson Probability Models
Binomial Random Variables Binomial Probability Distributions
Binomial Random Variables • Through 2/10/2015 NC State’s free-throw percentage is 67.4% (231st out 351 in Div. 1). • If in the 2/11/2015 game with UVA, NCSU shoots 11 free-throws, what is the probability that: • NCSU makes exactly 8 free-throws? • NCSU makes at most 8 free throws? • NCSU makes at least 8 free-throws?
“2-outcome” situations are very common • Heads/tails • Democrat/Republican • Male/Female • Win/Loss • Success/Failure • Defective/Nondefective
Probability Model for this Common Situation • Common characteristics • repeated “trials” • 2 outcomes on each trial • Leads to Binomial Experiment
Binomial Experiments • n identical trials • n specified in advance • 2 outcomes on each trial • usually referred to as “success” and “failure” • p “success” probability; q=1-p “failure” probability; remain constant from trial to trial • trials are independent
Classic binomial experiment: tossing acoin a pre-specified number of times • Toss a coin 10 times • Result of each toss: head or tail (designate one of the outcomes as a success, the other as a failure; makes no difference) • P(head) and P(tail) are the same on each toss • trials are independent • if you obtained 9 heads in a row, P(head) and P(tail) on toss 10 are same as P(head) and P(tail) on any other toss (not due for a tail on toss 10)
Binomial Random Variable • The binomial random variable X is the number of “successes” in the n trials • Notation: X has a B(n, p) distribution, where n is the number of trials and p is the success probability on each trial.
Rationale for the Binomial Probability Formula n! P(x) = •px•qn-x (n –x )!x! Number of outcomes with exactly x successes among n trials
Binomial Probability Formula n! P(x) = •px•qn-x (n –x )!x! Probability of x successes among n trials for any one particular order Number of outcomes with exactly x successes among n trials
The sum of all the areas is 1 p(5)=.246 is the area of the rectangle above 5 Graph of p(x); x binomial n=10 p=.5; p(0)+p(1)+ … +p(10)=1 Think of p(x) as the area of rectangle above x
Binomial DistributionExample: Pepsi vs Coke • In a taste test of Pepsi vs Coke, suppose 25% of tasters can correctly identify which cola they are drinking. • If 12 tasters participate in a test by drinking from 2 cups in which 1 cup contains Coke and the other cup contains Pepsi, what is the probability that exactly 5 tasters will correctly identify the colas?
Binomial Distribution Example • Shanille O’Keal is a WNBA player who makes 25% of her 3-point attempts. • Assume the outcomes of 3-point shots are independent. • If Shanille attempts 7 3-point shots in a game, what is the expected number of successful 3-point attempts? • Shanille’s cousin Shaquille O’Neal makes 10% of his 3-point attempts. If they each take 12 3-point shots, who has the smaller probability of making 4 or fewer 3-point shots? Shanille has the smaller probability.
9, 10, 11, … , 20 Using binomial tables; n=20, p=.3 • P(x 5) = .4164 • P(x > 8) = 1- P(x 8)= 1- .8867=.1133 • P(x < 9) = ? • P(x 10) = ? • P(3 x 7)=P(x 7) - P(x 2) .7723 - .0355 = .7368 8, 7, 6, … , 0 =P(x 8) 1- P(x 9) = 1- .9520
Binomial n = 20, p = .3 (cont.) • P(2 < x 9) = P(x 9) - P(x 2) = .9520 - .0355 = .9165 • P(x = 8) = P(x 8) - P(x 7) = .8867 - .7723 = .1144
Color blindness The frequency of color blindness (dyschromatopsia) in the Caucasian American male population is estimated to be about 8%. We take a random sample of size 25 from this population. We can model this situation with a B(n = 25, p = 0.08) distribution. • What is the probability that five individuals or fewer in the sample are color blind? Use Excel’s “=BINOMDIST(number_s,trials,probability_s,cumulative)” P(x≤ 5) = BINOMDIST(5, 25, .08, 1) = 0.9877 • What is the probability that more than five will be color blind? P(x> 5) = 1 P(x≤ 5) =1 0.9877 = 0.0123 • What is the probability that exactly five will be color blind? P(x= 5) = BINOMDIST(5, 25, .08, 0) = 0.0329
B(n = 25, p = 0.08) Probability distribution and histogram for the number of color blind individuals among 25 Caucasian males.
What are the mean and standard deviation of the count of color blind individuals in the SRS of 25 Caucasian American males? µ = np = 25*0.08 = 2 σ = √np(1 p) = √(25*0.08*0.92) = 1.36 What if we take an SRS of size 10? Of size 75? µ = 10*0.08 = 0.8 µ = 75*0.08 = 6 σ = √(10*0.08*0.92) = 0.86 σ = √(75*0.08*0.92) = 2.35 p = .08 n = 10 p = .08 n = 75
Recall Free-throw question • Through 2/10/15 NC State’s free-throw percentage was 67.4% (231st in Div. 1). • If in the 2/11/15 game with UVA, NCSU shoots 11 free-throws, what is the probability that: • NCSU makes exactly 8 free-throws? • NCSU makes at most 8 free throws? • NCSU makes at least 8 free-throws? • n=11; X=# of made free-throws; p=.674 p(8)= 11C8 (.674)8(.326)3 =.243 • P(x ≤ 8)=.750 • P(x ≥ 8)=1-P(x≤7) =1-.5064 = .4936
Geometric Random Variables • Geometric Probability Distributions • Through 2/10/2015 NC State’s free-throw percentage is 67.4 (231st of 351 in Div. 1). In the 2/11/2015 game with UVA what is the probability that the first missed free-throw by the ‘Pack occurs on the 5th attempt?
Binomial Experiments • n identical trials • n specified in advance • 2 outcomes on each trial • usually referred to as “success” and “failure” • p “success” probability; q=1-p “failure” probability; remain constant from trial to trial • trials are independent • The binomial rv counts the number of successes in the n trials
The Geometric Model • A geometric random variable counts the number of trials until the first success is observed. • A geometric random variable is completely specified by one parameter, p, the probability of success, and is denoted Geom(p). • Unlike a binomial random variable, the number of trials is not fixed
The Geometric Model (cont.) Geometric probability model for Bernoulli trials: Geom(p) p = probability of success q = 1 – p = probability of failure X = # of trials until the first success occurs p(x) = P(X = x) = qx-1p, x = 1, 2, 3, 4,…
Example The American Red Cross says that about 11% of the U.S. population has Type B blood. A blood drive is being held in your area. • How many blood donors should the American Red Cross expect to collect from until it gets the first donor with Type B blood? Success=donor has Type B blood X=number of donors until get first donor with Type B blood
Example (cont.) The American Red Cross says that about 11% of the U.S. population has Type B blood. A blood drive is being held in your area. • What is the probability that the fourth blood donor is the first donor with Type B blood?
Example (cont.) The American Red Cross says that about 11% of the U.S. population has Type B blood. A blood drive is being held in your area. • What is the probability that the first Type B blood donor is among the first four people in line?
Example Shanille O’Keal is a WNBA player who makes 25% of her 3-point attempts. • The expected number of attempts until she makes her first 3-point shot is what value? • What is the probability that the first 3-point shot she makes occurs on her 3rd attempt?
Question from first slide • Through 2/10/2015 NC State’s free-throw percentage was 67.4%. In the 2/11/2015 game with UVA what is the probability that the first missed free-throw by the ‘Pack occurs on the 5th attempt? “Success” = missed free throw Success p = 1 - .674 = .326 p(5) = .6744 .326 = .0673
Poisson Probability Models • The Poisson experiment typically models situations where rare events occur over a fixed amount of time or within a specified region • Examples • The number of cellphone calls per minute arriving at a cellphone tower. • The number of customers per hour using an ATM • The number of concussions per game experienced by the participants.
Poisson Experiment • Properties of the Poisson experiment • The number of successes (events) that occur in a certain time interval is independent of the number of successes that occur in another time interval. • The probability of a success in a certain time interval is • the same for all time intervals of the same size, • proportional to the length of the interval. • The probability that two or more successes will occur in an interval approaches zero as the interval becomes smaller.
The Poisson Random Variable • The Poisson random variable X is the number of successes that occur during a given time interval or in a specific region • Probability Distribution of the Poisson Random Variable.
Example • Cars arrive at a tollbooth at a rate of 360 cars per hour. • What is the probability that only two cars will arrive during a specified one-minute period? • The probability distribution of arriving cars for any one-minute period is Poisson with = 360/60 = 6 cars per minute. Let X denote the number of arrivals during a one-minute period.
Example (cont.) • What is the probability that at least four cars will arrive during a one-minute period? • P(X>=4) = 1 - P(X<=3) = 1 - .151 = .849