Download
1 / 3
30 likes | 128 Views
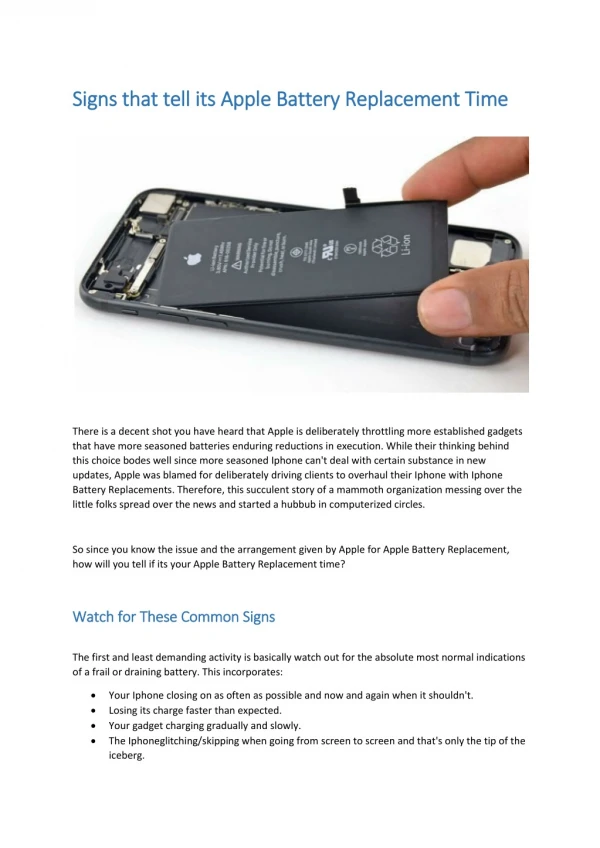
Replacement Sales. Now we are in 2002 and would like to know how many units of microwave oven consumers are going to scrap so that we could estimate the forecast based on the replacement sales.

E N D
Replacement Sales • Now we are in 2002 and would like to know how many units of microwave oven consumers are going to scrap so that we could estimate the forecast based on the replacement sales. • Out of the sample of 1,170 respondents who own microwave, 300 of those bought microwave in 2002 and 3 of those scrapped and replaced their oven within the same year. 250 bought in 2001, 5 of those scrapped and replaced their oven in 2002.
Scrappage Rate Year Product No. of Units Sample units Annual Annual No. of Units Was purchased owned in scrapped scrappage survival at the end sample during 2002 rate rate of 2002 per 1000 originally sold 2002 300 3 0.01 0.99 990 2001 250 5 0.02 0.98 970 2000 200 10 0.05 0.95 922 1999 150 15 0.10 0.90 830 1998 100 30 0.30 0.70 581 1997 100 30 0.30 0.70 406 1996 50 40 0.80 0.20 81 1995 20 20 1.00 0.00 0
Estimating Replacement Potential for 2003 Year Industry % Left No. Left Annual 2003 product sales at start of at start of scrappage replacement Was 2003 2003 rate potential sold from past sales 2002 230,000 0.990 227,770 0.02 4,554 2001 200,000 0.970 194,000 0.05 9,700 2000 250,000 0.922 230,500 0.10 23,050 1999 240,000 0.830 199,200 0.30 55,760 1998 230,000 0.581 133,630 0.30 40,089 1997 260,000 0.406 105,560 0.80 84,448 1996 210,000 0.081 17,010 1.00 17,010 1995 200,000 0.000 0 0 238,611