Download
1 / 21
210 likes | 416 Views
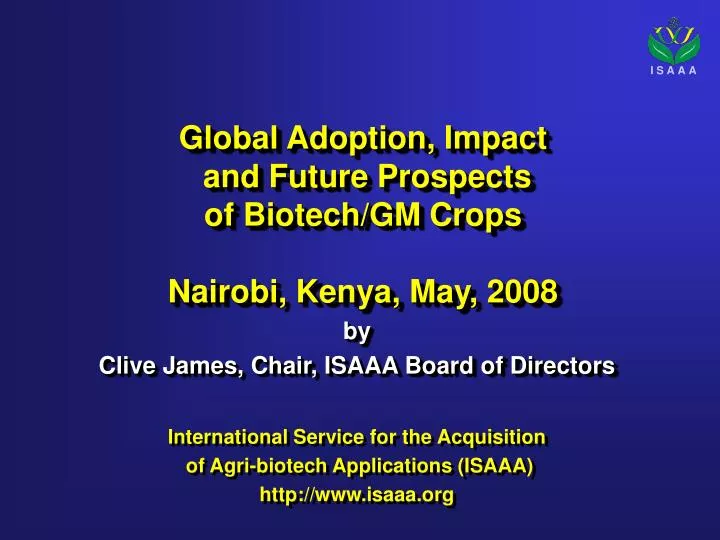
Global Adoption, Impact and Future Prospects of Biotech/GM Crops Nairobi, Kenya, May, 2008. by Clive James, Chair, ISAAA Board of Directors International Service for the Acquisition of Agri-biotech Applications (ISAAA) http://www.isaaa.org. ISAAA.

E N D
Global Adoption, Impact and Future Prospects of Biotech/GM Crops Nairobi, Kenya, May, 2008 by Clive James, Chair, ISAAA Board of Directors International Service for the Acquisition of Agri-biotech Applications (ISAAA) http://www.isaaa.org
ISAAA • Not-for-Profit Charity, co-sponsored by public and private sector organizations • Mission of ISAAA : • Share knowledge on crop biotechnology so that the global community is more well informedabout the attributes and potential of the new technologies • Contribute to poverty alleviation by increasing crop productivity and income generation, particularly for resource-poor farmers, and to bring about a safer environment and more sustainable agricultural development, through crop biotechnology. For more information, visit http://www.isaaa.org
The Three Philanthropic Co-sponsors of the ISAAA 2007 Report • The Rockefeller Foundation, USA– associated with the green revolution that saved 1 billion people from hunger in the 1960s, largely in Asia • Ibercaja, Spain – the fourth largest bank in Spain based in the maize growing area of the country where Bt maize is successfully grown – the largest area of Bt maize in the EU • Fondazione Bussolera-Branca, Italy –supports the sharing of knowledge to aid global society to make knowledge-based decisions about biotech crops • Source: Clive James, 2008
A Food, Feed, & Fiber Strategy to Double Global Production by 2050 • NO SINGLE APPROACHwill allow food, feed, and fiber production to be doubled SUSTAINABLY by 2050 for 9 billion people • Conventional crop improvement ALONE will not double crop production by 2050 – GM/BIOTECH CROPS NOT A PANACEA but important • Successful strategy must have MULTIPLE APPROACHES that address all the principal issues that include: • Population Stabilization • Improved food distribution systems • A Technology Component is ESSENTIAL-- A crop improvement STRATEGY THAT INTEGRATES the BEST of CONVENTIONAL AND the BEST of BIOTECH to optimize productivity and CONTRIBUTEto food feed and fiber security
Selected International Cereal Prices US$/tonne Rice Wheat Maize 2006 2007 2008 Source: FAO, April, 2008
Acceptance Issues related to Biotech Crops • Food safety – food as safe, or safer, than conventional • Environmental Impact • Gene Flow -conservation of biodiversity- coexistence • Effect on non-target organisms – Target specific tech • Management of Bt resistance – durability - a challenge • Ownership of the technology • Role of the Private sector, IPR • Ethical considerations • Above issues impact on INTERNATIONAL TRADE
Global Area (Million Hectares) of Biotech Crops, 2007: by Country
140 120 Total Industrial 100 Developing 80 60 40 20 0 1996 1997 1998 1999 2000 2001 2002 2003 2004 2005 2006 2007 Global Area of Biotech Crops, 1996 to 2007: Industrial and Developing Countries (Million Hectares) Source: Clive James, 2008
M Acres 1976 800 1729 666 million hectares 700 = 1.6 billion acres 1482 600 1235 500 988 400 741 300 200 494 100 247 0 0 1996 1997 1998 1999 2000 2001 2002 2003 2004 2005 2006 2007 Accumulated Global Area of Biotech Crops, 1996 to 2007 (Million Hectares) Source: Clive James, 2008
2007 Highlights -- Area continues to soar • 2007 -12th year of commercialization of biotech crops • 114.3 million hectares planted globally • 12.3 mill ha increase = + 12% - 2nd highest in 5 years • 114.3 m. has in 23 countries, Chile and Poland new countries in 2007 – 20% of area stacked- 2 or 3 genes • 12 mill. biotech farmers, - 90% or 11 million are resource-poor farmers – 1st time to exceed 10 million small farmers in dev. countries - 12 dev. countries • Of 6.5 billion global population 55%, equivalent to 3.6 billion, lived in the 23 biotech countries in 2007 • Source: Clive James 2008
M Acres 160 396 148 Conventional 140 346 Biotech 120 297 91 100 247 80 198 60 148 35 40 99 27 20 49 0 0 64% 43% 24% 20% Soybean Cotton Maize Canola Global Adoption Rates (%) for Principal Biotech Crops (Million Hectares) 2007 Source: Clive James, 2007
Developing countries continue to record bigger gains in biotech area than industrial countries in 2007 • From 1996 to 2007, % of global area of biotech crops in developing countries increased every single year – reached 43% in 2007, up from 40% in 2006 • Biotech area in developing countries grew by 8.5 million hectares, or 21% in 2007, compared with 3.8 million hectares or 6% in industrial countries • The 5 mega biotech countries of Asia, Lat Am & Africa China, India, Argentina, Brazil and South Africa, with acombined population of 2.6 billion (40% of global) grew 46 million hectares of biotech crops in 2007, equivalent to 40% of global total • Source: Clive James, 2008
Impact of Biotech Crops Source; Compiled by Clive James , 2008 • IMPROVED PRODUCTIVITY AND INCOME – Increased yields of 5 to 50%. Farm income gains of $7 billion in 2006 & $34 billion 1996-2006; $17.5 billion in industrial, $16.5 billion in dev countries • PROTECT BIODIVERSITY - Double crop production on same area of 1.5 million hectares of crop land - save forests/biodiversity - 13m ha loss/year in DCs • ENVIRONMENTAL IMPACT - Reduce need for external inputs - Saving of 289,000 MT a.i. pesticides from 1996 to 2006 • - Saved 15 bill kg C02in 2006- 6.5m less cars - climate change • - Conservation of soil & WATER = SUSTAINABILITY • SOCIAL BENEFITS • - Contribution to alleviation of poverty of 11 million small farmers in 2007, compared with 9.3 million in 2006 • MORE AFFORDABLE FOOD,FEED &FIBER
Biotech Crops – Global Economic Benefits: 1996 to 2006, and 2006 1996-2006 2006 ALL COUNTRIES USA Argentina China Brazil India Canada Others Source: Brookes and Barfoot 2008 $ 33.7 billion $ 15.9 billion $ 6.6 billion $ 5.8 billion $ 1.9 billion $ 1.3 billion $ 1.2 billion $ 1.0 billion $ 7.0 billion $ 2.9 billion $1.3 billion $0.8 billion 0.6 billion $0.8 billion $0.3 billion $0.3 billion
The Future – The 2nd Decade, 2006 - 2015 • Continued growth in US, Canada and Australia with expanded range of crops featuring more agronomic and quality traits plus the very important trait of DROUGHT TOLERANCEin about 3 years . • Brazilhas enormous potential in Lat America • 1st decade 1996-2005, was the decade of the Americas, 2nd decade will likely feature strong growth in Asia led by India, China & new countries like Vietnam and Pakistan • Africa - # of biotech countries to increase modestly , led by Egypt in N. Africa, Burkina Faso in W Africa and Kenya in E. Africa • Slow to modest growth in EU, - more potential inEastern Europe • Use of biotech crops for biofuel-ethanol & biodiesel- has potential to contribute to higher biomass production and higher efficiency • Compiled by Clive James, 2008
Challenges for the Future • Responsible and efficient stewardship • Improved Communication with Society. Knowledge-based decisions re Biotech crops
ISAAA’s Global Knowledge Center (KC) on Crop Biotechnology & Network of Biotechnology Information Centers (BICs) Russia Italy USA Spain Bulgaria China Egypt Pakistan Bangladesh *Mexico Mali Vietnam India *Senegal *Nigeria Sri Lanka Thailand Philippines ISAAA’s Global KC *Costa Rica Malaysia Kenya Brazil Indonesia *Chile Argentina South Africa Knowledge and Experience Sharing 21 Current nodes 5 Future nodes Global Knowledge Center (KC), based at ISAAA, S.E.Asia Center in the Philippines
ISAAA CropBiotech Update Recipients January 2001 – April 2008 • Includes recipients of CropBiotech Update translations in Arabic, Bahasa Indonesia, Bangla, Chinese, French, Italian, Portuguese, Spanish, Thai and Vietnamese • Does not include subscribers to other list serves that pick up articles from the CropBiotech Update; estimated at 30,000
Knowledge Sharing with Global Society Impact of ISAAA Annual Global Status Review (As of April 30, 2007) ISAAA Briefs No. 37-2007 – “Global Status of Commercialized Biotech/GM Crops: 2007”
The Future - Biotech Crop contribution to 2015 MDG Goals, and more Sustainable Agriculture • STRATEGY WITH FOUR THRUSTS • 1. Increasing global crop productivity to improve food, feed and fiber production in sustainable crop production systems that also conserve biodiversity AND PROVIDE MORE AFFORDABLE FOOD • 2. Contributing to the alleviation of poverty and hunger • 3. Reducing the Environmental Footprint of Agriculture • 4. Mitigating Climate Change – speeding the breeding • Complied by Clive James, 2008
GLOBAL AREA OF BIOTECH CROPS Million Hectares (1996 to 2007) Total 23 Biotech Crop Countries 140 Industrial Developing 120 100 80 60 40 20 0 1996 1997 1998 1999 2000 2001 2002 2003 2004 2005 2006 2007 Increase of 12%, 12.3 million hectares (30 million acres), between 2006 and 2007. Source: Clive James, 2007.