Download
1 / 22
220 likes | 326 Views
Long Term Global Biofuel Projections With Agricultural Resource Use under Different Oil Price Scenarios. John Miranowski Professor of Economics, Iowa State University with Alicia Rosburg , Assistant Professor, University of Northern Iowa. Introduction. Sabbatical opportunity at FAO (2011)

E N D
Long Term Global Biofuel Projections With Agricultural Resource Use under Different Oil Price Scenarios John Miranowski Professor of Economics, Iowa State University with Alicia Rosburg, Assistant Professor, University of Northern Iowa
Introduction • Sabbatical opportunity at FAO (2011) • “Long Term Global Biofuel Projections With Agricultural Resource Use to 2080” • What would long term global market model tell us to expect? • Given feedstock demand for energy content, crude oil price will drive biofuel or parity price for foreseeable future. • Renewable energy programs have limited long term (LT) impact (US-RFS & EU-RED) – “Fossil fuel attacks on mandates, subsidies, put renewables at risk.” (DSM Register, June 18, 2012). Fracking NG, Oil • Implications for resource use are more complicated but technology and productivity growth will limit LUC and other input use.
Rationale and Framework of Analysis • “Important resource problems are LT issues.” T.W. Schultz • If biofuel is small component of energy market, the demand for biofuel is perfectly elastic for a given oil price • Energy content of feedstock is demanded by biofuel processor. The processor can only pay an amount equal to energy value of biofuel, plus co-product value, less cost of feedstock conversion. • The minimum amount the feedstock producer will accept to deliver feedstock reflects production, harvest, storage, transport, and opportunity costs.
Rationale and Framework of Analysis • Parity price graphs relate maximum price the biofuel process can pay for feedstock given alternative oil price scenarios. • In the LT, the price of oil puts both floor and ceiling on commodity and biomass feedstock prices.
Figure 1. Breakeven sugarcane price (PD) – BEFS Peru(Commercial/smallholder coastal)
Figure 1 (cont). Breakeven sugarcane price (PD) – BEFS Tanzania(BEFS Tanzania – Scenario 1)
Rationale and Framework of Analysis • In LT, inputs are variable and substitutable. Short term market shocks and responses not issue. • Government biofuel incentives and mandates put upward pressure on food and feedstock prices, but not LT phenomena. • Technological change and productivity growth lower unit costs and competitive markets lead to lower profit margins and sectoral adjustment. Improved resource use efficiency - LUC,N. • Agricultural commodities follow the traditional market paradigm of declining LT real prices.
Long Term Biofuel Breakeven Model • Determines maximum LT breakeven price the processor can pay for feedstock given oil price scenarios and biofuel conversion costs. • Determines minimum LT breakeven price producer is willing to accept given feedstock production, harvest, storage, transportation, and opportunity costs. • Budgeting model with step-wise LT supply curve. • Gap between producers’ willingness to accept and processors’ willingness to pay indicates when LT biofuel market does not meet necessary sustainability condition.
Background Studies and Database • We assume three LT crude oil price scenarios - $60, $100, and $140/bbl • Schmidhuber papers, various years. • FAO BEFS Reports - Peru, Tanzania, Thailand • IEA Biofuels Study, 2011 • Kazi, et al, 2011 • ALTF Report, 2009, NRC Report, 2011, Rosburg and Miranowski, 2011
LT Breakeven Is Not Only Sustainability Consideration • Competitive biorefineries are large scale plants requiring continuous throughput of high-density, dependable feedstock supplies. • Countries and regions need price elastic feedstock with excess supplies. Otherwise, any supply disruptions may force biofuel plant shutdowns. Small-scale options? • LT productivity growth in feedstock production and conversion to biofuel.
Figure 5. Price gap (PS – PD), current minus future values with productivity growth at$100/bbl oil
Figure 5 (cont). Price gap (PS – PD), current minus future values with productivity growth at $100/bbl oil
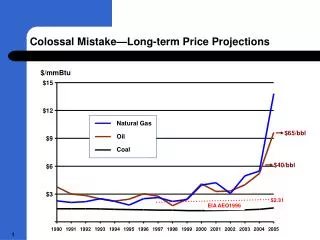
Summary and Conclusions • First generation biofuel ($100/bbl oil) largely competes because of government intervention (except sugar). Other feedstock are possibilities with high LT oil price ($140/bbl). NG • If LT oil price is high and tropical countries can expand feedstock supplies to sufficient quantities, they may become competitive biofuel suppliers. • Productivity growth in feedstock production and conversion may have important implications for biofuel. Continue research! • Anticipate LT global cropland base will not expand because limited biofuel expansion and productivity growth.
Figure . Processor breakeven feedstock prices @ $100/bbl oil