Download

1 / 61
610 likes | 618 Views
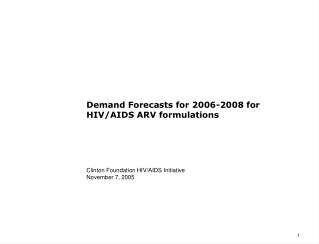
This review analyzes the forecasts and outcomes of the 2005 and 2006 hurricane seasons, including tropical storm and hurricane counts, major hurricanes, and accumulated cyclone energy. The accuracy of NOAA's outlooks for the North Atlantic and East Pacific basins is evaluated. The analysis also includes comparisons with previous years and explores the influence of climate patterns on hurricane activity.

E N D
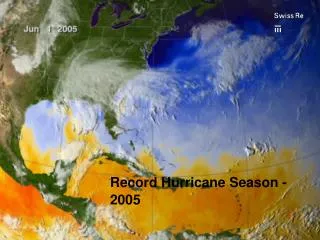
A Review of 2005 & 2006 Hurricane Seasons and Forecasts Muthuvel Chelliah Climate Prediction Center, NCEP/NWS NOAA 31st Annual Climate Diagnostics and Prediction Workshop Earth System Research Laboratory, Boulder, CO. October 23, 2006.
Two seasons: 2005 & 2006 • Two Basins (at least): North Atlantic & East Pacific (third :Central Pacific) • Two Outlooks: May & August for N.Atlantic and only May Outlook for E. Pacific. • Verification ( #of Tropical Storms TS, Hurricanes H, Major Hurricanes MH and Accumulated Cyclone Energy (ACE) Index. • I will show even other years for comparison and historical behavior. • NOAA’s outlooks for N. Atlantic (since 1998) and E. Pacific (since 2003, Experimental in 2003-2004) have been fairly accurate. • This is a very preliminary analysis of what happened to the forecasts this 2006 season (not over yet, ends in November).
All outlooks are official NOAA outlooks and are made by teams of scientists from: • Climate Prediction Center (CPC – Lead Center) in Maryland • National Hurricane Center (NHC) & • Hurricane Research Division (HRD) in Florida • Hydrometeorological Prediction Center (HPC) in Maryland North Atlantic Outlook Team: CPC:Gerald Bell (Lead), Muthuvel Chelliah, Kingste Mo NHC: Christopher Landsea, Eric Blake and Richard Pasch HRD: Stanley Goldenberg East Pacific Outlook Team: CPC: Muthuvel Chelliah (Lead), Gerald Bell, Kingtse Mo NHC: Christopher Landsea and Eric Blake HPC: Todd Kimberlain
2005 Atlantic Seasonal Activity Outlook - May NOAA’s Accumulated Cyclone Energy (ACE) Index
NOAA’s Updated 2005 Atlantic Hurricane Outlook 95% to 100% Chance of an Above-Normal Season (Measured by forecasted numbers, strength, and duration of named storms) Forecasted Seasonal Totals 18-21 Tropical Storms 9-11 Hurricanes 5-7 Major Hurricanes 180%-270% of median ACE value Forecasted for August-November 2005 11-14 Tropical Storms 7-9 Hurricanes 3-5 Major Hurricanes 110%-200% of median ACE value Already during 2005: 7 Tropical Storms, 2 Major Hurricanes (Dennis and Emily) ACE index = 68% of median
For 2006 Less North Atlantic Activity Expected Than 2005 • 2006 Atlantic Hurricane Outlooks: • May Outlook called for less activity than 2005 • August Outlook called for even less activity than May outlook 9
East Pacific Hurricane ActivityMay 2005 Outlook NOAA’s Accumulated Cyclone Energy (ACE) Index
North Atlantic Hurricane Season TS - 27 (18-21) H - 15 (9-11) MH - 7 (5-7) 2005 ABOVE-NORMAL (Hyper-Active) ACE - 285% (180-270%) 2006 NORMAL 0.0 TS - 9 (12-15) H - 5 (7-9) MH – 2 (3-4) ACE – 90 % ? (110-170%) 0.5? Tracks Graphics Courtesy of Unisys
East Pacific Hurricane Season TS - 15 (11-15) H - 7 (6-8) MH - 2 (2-4) 2005 BELOW NORMAL ACE: 65 % (45-95%) 2006 NORMAL Tracks Graphics Courtesy of Unisys TS - 16 (12-16) H - 8 (6-8) MH - 5 (1-3) ACE: 95 % (45-85%)
2004 2004 North Atlantic ACE >250% 1995 ACE >250% -0.5
1993 Aug-Sep-Oct Nino 3.4 Index 0.4(from CPC) – officially NEUTRAL 1993 1994 Aug-Sep-Oct Nino 3.4 Index 0.7 (from CPC) – officially El Nino 1994
Basis and Procedures for the Seasonal Hurricane Outlooks • Interannual and multi-decadal extremes in tropical North Atlantic, East Pacific and Central Pacific hurricane activity are not random. • Instead, they result from a set of coherent and inter-related atmospheric and oceanic conditions controlled by tropical climate patterns, and some possibly related to increases in ocean surface temperatures. • NOAA’s makes seasonal hurricane outlooks by first analyzing and predicting these leading recurring patterns of climate variability in the Tropics, and then predicting their impacts on hurricane activity. • The Two dominant climate factors that influence/control • seasonal hurricane activity in all three regions are: • El Niño/ Southern Oscillation (ENSO): Gray (1984) • Tropical multi-decadal climate variability: Chelliah and Bell (2004) • Bell and Chelliah (2006)
Regional North Atlantic Conditions associated with Active Hurricane Season Warmer SSTs Lower Wind Shear Lower Surface Pressure (Red Area) Higher Pressure in Upper Atmosphere Favorable Winds From Africa Upper-level Easterlies Expand Westward (Green arrows) Weaker Low-Level Easterly Winds (Blue arrow)
_ 200-hPa Velocity Potential Loading Patterns during ASO: Contours shown for “active” Atlantic hurricane eras. East-west see-saw in tropical convection between West Africa and Amazon basin + _ +
Composite Conditions Associated with Active/ Inactive Atlantic Hurricane Seasons Anti- Cyclonic • Regional Anomalies Exhibit Larger-Scale Convective Signature • Inter-hemispheric symmetry • Baroclinic structure to wind anomalies (reversal in anomalies between 200-hPa and 850-hPa).
Lower Shear Higher Shear Enhanced easterly vertical shear produces 3-celled pattern of anomalous shear magnitude
Since 1995 (thorough 2005) – 9 out of 11 years are above-normal active hurricane seasons in N.Atlantic – except for two El Nino years 1997 and 2002. • The generally negative correlation between the N.Atlantic and E. Pacific basin hurricane activities has strengthened in the last couple of decades.
The opposite phase relation between the two basins’ activities seems to extend far back. BUT the East Pacific Data considered unreliable before ~ 1965/1970
The Transition to Weak El Niño Conditions was not Predicted The Climate Forecast System (CFS) forecast issued May 9th 2006 indicated slightly below-average SST’s over central equatorial Pacific, thus failing to predict the impending El Niño. CFS Forecast SST Departures (oC) Forecast Issued May 9th 2006 Observed SST Departures (oC) 15
Very Warm Waters Returned during August 2006 During the peak of the 2006 season, tropical Atlantic SSTs were generally 1-2oF above Average. Departures were sometimescomparable to last year (2-3oF). 1 2 1 2 1 2 16
Forecasts of current El NinoinAPRIL 2006 As measured by Nino 3.4 SST Anomaly ENSO ADVISORY: La Niña conditions are expected to continue during the next 1-3 months.
Forecasts of current El Ninoin MAY 2006 ENSO ADVISORY: ENSO-neutral conditions are expected to prevail during the next 3-6 months.
Forecasts of current El Ninoin JUNE 2006 ENSO ADVISORY: ENSO-neutral conditions are expected to prevail during the next 3 months.
Forecasts of current El Ninoin JULY 2006 ENSO ADVISORY: ENSO-neutral conditions are expected to prevail during the next 3 months.
Forecasts of current El Ninoin AUGUST 2006 ENSO ADVISORY: ENSO-neutral conditions are expected to continue for the next one to three months, with a 50% chance that weak El Niño conditions will develop by the end of 2006.
Forecasts of current El Ninoin SEPTEMBER 2006 ENSO ADVISORY: ENSO-neutral conditions are expected to continue for the next one to two months, with weak warm episode (El Niño) conditions likely by the end of 2006.
In Closing….. • So, what happened to the ‘Above Normal’ North Atlantic Hurricane activity AND the ‘Below Normal’ East Pacific outlook ? The season is not over yet (ends in November)– But, most likely, the season for both basins will end as NORMAL. • Not just NOAA, but all other outlooks did indicate ‘Above Normal’ activity for the North Atlantic basin during 2006 season. NOAA has been issuing Hurricane outlooks since 1998 and this is the first year the outlook may turn out to be not so pretty.. • Preliminary culprit: The unexpected and sudden emergence of El Nino – right in the middle of the season - which was not forecast by any of the dynamical or the statistical models. – Needs further analysis • After 2005 being such a record active year, to be followed by ‘such a bla..’ 2006 season, hopefully brings some sanity to the global warming – hurricane connection debate - at least demonstrates that just local ocean warm waters alone (thermodynamic argument – GCM style thinking) is not enough, and that atmospheric circulation factors such as vertical wind shear, cyclonic vorticity, etc. (due to local and remote influences) are just as important in deciding the season’s activity.
Summary • I have not addressed cause(s) of the LF/ multi-decadal variability, nor has this issue been addressed in Bell and Chelliah (2006). Our work focuses on understanding the observations. This is particularly important if we are to understand how combinations of climate factors (multi-decadal variability and GH warming) will impact hurricane activity in the future. • The leading tropical multi-decadal modes of convective variability account for many key circulation and SST anomalies associated with seasonal and multi-decadal extremes in Atlantic hurricane activity since 1950. • The transition to current active Atlantic hurricane era shows strong link to phase change in tropical multi-decadal signal—see-saw in tropical convection between West Africa and Amazon Basin. • This phase change accounts for many conditions known to favor active hurricane seasons, and is consistent with transition to warm phase of AMO. • Warmer Atlantic SSTs since 1995 are associated with significantly more hurricanes in large part because of their common association with overlying circulation anomalies.
Some Unresolved Issues of Concern • We see large tropical circulation/ convection/ SST changes occurring between active/ inactive hurricane eras. • Numerical simulations indicate little to no wind changes across tropical Atlantic with increasing CO2. Seems inconsistent with observations, suggesting weak (at best) CO2 impact at this time. • How can minimal impact on winds be maintained if SST increases substantially in a future CO2 world? Is this realistic? • If not, how might CO2 increases affect leading tropical modes. • Ultimate cause(s) of tropical multi-decadal variability • We should study potential CO2 impacts simultaneous with increasing our understanding of the tropical multi-decadal variability.
AEJ Tropical disturbances remain in extended region of cyclonic shear while moving westward into low vertical shear, warm SST environment of central/ western MDR.
Measuring total seasonal activity: The Accumulated Cyclone Energy (ACE) index The phrase "total seasonal activity" refers to the collective intensity and duration of Atlantic named storms and hurricanes occurring during a given season. The measure of total seasonal activity used by NOAA is called the Accumulated Cyclone Energy (ACE) index. The ACE index is a wind energy index, defined as the sum of the squares of the maximum sustained surface wind speed (knots) measured every six hours for all named systems while they are at least tropical storm strength. NOAA uses the ACE index, combined with the numbers of named storms, hurricanes, and major hurricanes, to categorize North Atlantic hurricane seasons as being above normal, near normal, or below normal. NOAA’s Atlantic hurricane season classifications Above-normal season: An ACE index value well above 103 x 104 kt2 (corresponding to 117% of the median ACE value or 110% of the mean), or an ACE value slightly above 103 x 104 kt2 combined with at least two of the following three parameters being above the long-term average: number of tropical storms, hurricanes, and major hurricanes. Near-normal season: An ACE index value in the range 66-103 x 104 kt2 (corresponding to 75%-117% of the median or 71%-110% of the mean), or an ACE index value slightly above 103 x 104 kt2 but with less than two of the following three parameters being above the long-term average: numbers of tropical storms, hurricanes, and major hurricanes. Below-normal season: An ACE index value below 66 x 104 kt2, corresponding to below 75% of the median or 71% of the mean.
NOAA’s 2005 East Pacific Hurricane OutlookIssued 16 May 2005 Season and 2005 2005 Climatological Activity Type Outlook Observed Mean (1971-2000) Chance Above Normal 10% Below Normal Chance Near Normal 20% Chance Below Normal 70% Tropical Storms 11-15 15 15.5 Hurricanes 6-8 7 9.2 Major Hurricanes 2-4 2 4.5 ACE % of Median 45% - 95% 65% 110 %
ASO: Tropical Atlantic SSTA Regressed Observed SST warming in MDR is consistent with phase change in tropical multi-decadal signal and associated weaker trade winds.
Along 10N-15N, dry northeasterly flow replaced by moist inflow from deep tropics. Weaker trade winds, along with reduced flow of dry, subsiding northeasterly flow coming into MDR from east side of Bermuda High.
Less Activity was Expected and Forecast This Year in 2006 Than 2005 • 2006 Atlantic Hurricane Outlooks: • May Outlook called for less activity than 2005 • August Outlook called for even less activity than May outlook 9
Observedvs. Regressed Explained variance = 82%. Current active Atlantic hurricane era associated with phase change in tropical multi-decadal signal.