Download
1 / 49
490 likes | 621 Views
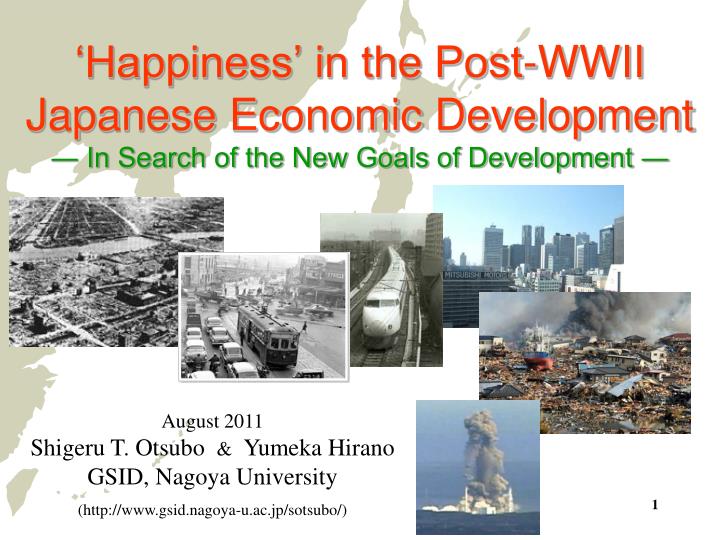
‘Happiness’ in the Post-WWII Japanese Economic Development ― In Search of the New Goals of Development ―. August 2011 Shigeru T. Otsubo & Yumeka Hirano GSID, Nagoya University (http:// www.gsid.nagoya-u.ac.jp / sotsubo /). Four Phases of Japanese Economic Development. Phase IV (2009-)

E N D
‘Happiness’ in the Post-WWII Japanese Economic Development ― In Search of the New Goals of Development ― August 2011 Shigeru T. Otsubo&Yumeka Hirano GSID, Nagoya University (http://www.gsid.nagoya-u.ac.jp/sotsubo/)
Four Phases of Japanese Economic Development Phase IV (2009-) Political Regime Change, 3.11 and Beyond 1. First Regime Change through Election LDP+ DP+ (2009) 2. 3.11 & Fukushima In Search of New Goals Phase I (1945-1960s) Catching-up Process 1. Post-war Rehabilitation & Economic Reforms (1945-mid 1950s) 2. High Economic Growth Period (mid 1950s – early 1970s) Democratization Common Goals Phase II (1970s-1980s) Failure to Reform & “Bubble” Economy 1. End of Catch-up Process & Need to Change (1970s1980s) 2. Overcoming Oil Crises (1970s ) 3. ‘Bubble’ (latter ½ of 1980s) No More Common Goals Autonomous Actions Phase III (1990s-2009) Long Stagnation & Koizuminomics 1. Bubble Burst (1990) & Long Stagnation (1990s-2000s) 2. Koizuminomics Supply-Side Policies & Widening Inequality (2001-2006-) Socio-Economic Outcome (-1970-) Environmental Issues Social Dimensions NNW(1973)
Phase I (1945-1960s) Catching-up Process 1. Post-war Rehabilitation & Economic Reforms (1945-mid 1950s) 2. High Economic Growth Period (mid 1950s – early 1970s) Democratization Common Goals Part I.2: High Economic Growth Period (mid 1950s – early 1970s)
Entering Virtuous Cycle Period of rapid growth (1955--1970) Average real growth rate Source: National Accounts Dual structure -- lower productivity and poorer working conditions in small businesses, consumption-goods and service sectors National consensus -- trickle-down strategy
3 Sacred Treasures in the latter half of 1950s 1956 Economic White Paper “We have come out of the post-war rehabilitation.” Drive to Material Happiness/Affluence 3 Cs in the High-growth period of 1960s 1964 : Tokyo Olympic Game, OECD Membership, IMF Article 8 Country TOYOTA Corolla (1966-) vs. NISSAN Sunny (1966-) 1000cc 1000cc 1100cc affluence of plus 100cc 1200cc neighbor’s car looks smaller
Negative Outcome of the Rapid Growth (2) Environmental degradation Source: Ministry of Environment Sulfur Dioxide (SO2) Yokkaichi-city Asthma
Source: Ministry of Environment Minamata Disease caused by mercury poisoning
Japan’s Indicators for Well-being First Wave of Well-being Metrics in the 1970s 1 1973 Net National Welfare(NNW) 国民純福祉 NNW = GNP + Monetary Value of Leisure Hours + Monetary Value of Housework - Costs of Preserving Environment - Imputed Damage by Pollution - Losses due to Urbanization (traffic accidents, longer commuting hours) NNW ナニガナンダカワカラナイ Not Understood. Not Accepted. Disappeared in a few years.
Japan’s Indicators for Well-being First Wave of Well-being Metrics in the 1970s 2 1974 Social Indicators(SI) 社会指標 10 Social Objectives 1. Health 2. Education/Learning 3. Employment and the Quality of Working Life 4. Leisure 5. Income/Consumption 6. Material Wealth/Stock 7. Crime and Law Enforcement 8. Family 9. Quality of Community Life 10. Social Class and Inter-class Mobility 1979 Social Indicators(SI) 新版社会指標 Few adjustments over the 1974 social indicators. For example, secure supply of Energy and Water is added as a subcategory under item 6.
Phase II (1970s-1980s) Failure to Reform & “Bubble” Economy 1. End of Catch-up Process & Need to Change (1970s1980s) 2. Overcoming Oil Crises (1970s ) 3. ‘Bubble’ (latter ½ of 1980s) No More Common Goals Autonomous Actions Phase II: End of Catching-Up Process Bubble Economy (1970s – 1980s)
Bubble Creation & Bubble Burst Financial Affluence -- Mirage ?
Phase III (1990s-2009) Long Stagnation & Koizuminomics 1. Bubble Burst (1990) & Long Stagnation (1990s-2000s) 2. Koizuminomics Supply-Side Policies & Widening Inequality (2001-2006-) Phase III.1: Lost Decades (1990s – 2000s)
Burst of Bubble and the ‘Lost Decade(s)’ Average annual growth rate 1956~60 8.8% 1961~65 9.2% 1966~70 11.1% 1971~75 4.5% 1976~80 4.4% 1981~85 3.3% 1986~90 4.9% 1991~95 1.5% 1996~2000 1.0% 2001~05 1.4% Source: ESRI, Cabinet Office, "Annual Report on National Accounts“ Note: data after 1995 is based on chain-linking method, 2000 price. Note: data before 1980 are based on the 1968-based SNA.
Deterioration of the government fiscal balance Source:OECD“Economic Outlook79”(June 2006)
Japan’s Indicators for Well-being Second Wave of Well-being Metrics : 1986 1986 New Social Indicators(NSI) 国民生活指標 8 Indicators for Different Aspects of Life 1. Health 2. Environment and Safety 3. Economic Stability 4. Family Life 5. Working Life 6. School Life 7. Community/Social Activities 8. Learning/Cultural Activities + Subjective Indicators 1. Satisfaction 2. Happiness 3. …
Japan’s Indicators for Well-being Second Wave of Well-being Metrics : 1992 1992 People’s Life Indicators(PLI) 新国民生活指標 ‘Well-being Indicators’ 「豊かさ指標」 8 Indicators for Different Aspects of Human Activities 1. Live 2. Consume 3. Work 4. Raise (Children) 5. Healing 6. Play 7. Learn 8. Socialize + 4 Indicators of Life Evaluation 1. Safety/Security 2. Fairness 3. Freedom 4. Comfortability Evaluated and implicitly ranked 47 prefectures of Japan. 1st : Fukui (relatively underdeveloped pref.) Last: Saitama (next to Tokyo, relatively developed/urbanized pref.) With complaints from low-ranked prefectures, PLI was discontinued after a few years (private firms succeeded the similar RANKING).
Phase III (1990s-2009) Long Stagnation & Koizuminomics 1. Bubble Burst (1990) & Long Stagnation (1990s-2000s) 2. Koizuminomics Supply-Side Policies & Widening Inequality (2001-2006-) Structural Reforms in the Japanese Development Model Phase III.2: Koizuminomics Supply-Side Policies (2001 – 2006-)
1986: Worker Dispatch Law 2004: Manufacturing sector included 1999: Job lines for dispatched workers were liberated (excl. manufacturing). Source: e-Stat Database of the Japanese Government Statistical Office
Source: e-Stat Database of the Japanese Government Statistical Office
PM Koizumi’s Supply-Side Economic Reform (2001 – 2006) Change in policy formation style -- Strengthening the role of Cabinet for policy formation -- Weakening the influence of the MOF -- Weakening the voice of the Liberal Democratic Party Settlement of the “Bubble” economy aftermath -- Banking reform, esp. disposal of NPLs -- Budget consolidation, esp. reduction in public works Measures to cope with depopulation and aging -- Reform of social security, health and disability insurance
Growth is good for the poor, butSupply-side policies for revitalizing economies put the country in the lower-right quadrant with widening inequality. Thatcherism (1979-1990-1997) Reaganomics (1981-1989) Koizuminomics (2001-2006-2009) Source: Dollar and Kraay (2007), Figure 1
Recent Movements in Japan’s Gini Indices Source : Author’s unscientific imagination !?
Phase IV (2009-) Political Regime Change, 3.11 and Beyond 1. First Regime Change through Election LDP+ DP+ (2009) 2. 3.11 & Fukushima In Search of New Goals Phase IV.1 : Political Regime Change from LDP+ to DP+
Source: Cabinet Office of Japan (1981-2008) “The National Survey on Lifestyle Preferences”
Source: Cabinet Office (2010) “Opinion Polls on People’s Livelihood”
Source: National Police Agency (2010) “Report on Suicide 2010”
Source: Historical Statistics of Japan, Statistics Bureau, Ministry of Internal Affairs and Communications
Source: Cabinet Office of Japan (2008) “The National Survey on Lifestyle Preferences”
Source: Cabinet Office of Japan (2010) “The National Survey on Lifestyle Preferences: People’s Happiness”
Source: Cabinet Office of Japan (2010) “The National Survey on Lifestyle Preferences: People’s Happiness”
Political Regime Change 2009 Buzzword of 2009 ‘Regime Change’ 32,000+ Suicides. 32,000+ Deaths in Solitude, 15 million Single-member Household Disconnected Society(無縁社会) Friendship/Fraternity (友愛) + ‘New Public Commons’ (新しい公共) Society where people with various backgrounds support each other for education/child raising, community development, crime prevention, disaster measures, medical/care services. The role of government in the 21st century is to (side-)support those civil societies and NPOs. Compiling Happiness Indicators (幸福度指標) for guidelines. PM Yukio Hatoyama (2009.9.16-2010.6.8)
PM Naoto Kan (2010.6.8-???) ‘Minimum Unhappiness Society’ (最小不幸社会) My belief is that the role of politics should be to minimise the factors that make the people of Japan and the rest of the world unhappy. That is to say, politics should aim to build a society with a minimum level of unhappiness. I say this because, while seeking great happiness - such as through a romantic relationship or a favorite activity like painting - is certainly important, this is not an area in which politics should be engaged very much. On the contrary, I believe politics should seek to eradicate poverty and avoid war. I want to rebuild Japan from the ground up and make it a more dynamic country, one which also produces more youngsters who walk on to the world stage and distinguish themselves. One way of doing so is to revive Japan's economy, rebuild Japan's public finances and turn Japan's social security system around. That is to say, we need to shore up the economy, public finances and social security together in a cohesive manner. Compiling Happiness Indicators (幸福度指標) for locating factors of unhappiness.
What do we Japanese need? We need, • New Goals based on (Individual) Happiness and Social Capital/Network • Connected Society with New Public Commons • Safe and Secured Life (安心、安全) • with Consideration for Others (思いやり) • 2) Economic Growth • Employment for meaningful life • To cope with the large stock of public debt • To reduce the burden on the younger/future • generation in supporting the aged/retired
Phase IV (2009-) Political Regime Change, 3.11 and Beyond 1. First Regime Change through Election LDP+ DP+ (2009) 2. 3.11 & Fukushima In Search of New Goals Phase IV.2 : 3.11 & Fukushima In Search of New Goals
Displaced People Orderly Evacuation Keeping the line for … (Kyodo pics.) Convenience Store Food Inconvenient but Orderly Life at Shelters Public Transportation
Nuclear Energy to Renewable Energy Extravagance to Modesty Disconnected Society to Connected Society
Traditional Values in Japanese Society 質実剛健 Shitsu Jitsu Go Ken (Simplicity and Fortitude) (Peace, Harmony, Unity) 和 Wa 武士道 Bushi-do 仁 Jin 義 gi 思いやり -(Duty)- (Humanity) (Justice) (Consideration for Others)
Disparities (格差) in Japanese Society Intergenerational Gap Gender Inequality Economic and Social Research Institute (ESRI) of the Cabinet Office released a study on generational imbalances in Japan’s social security system in 2009. According to the report, while older generations enjoy net benefits, younger/future generations will suffer large net burdens. While retirement age has been raised over the years, unemployment rates among younger age groups have been rising. Is Japan an ‘unequal society’ for younger/future generations? Human Development Report 1993, while introducing the gender –disparity-adjusted HDI, presented a Box on ‘Women in Japan.’ Japan’s HDI Rank in 1993: 1st Gender-disparity-adjusted HDI: 17th Tertiary enrolment ratio: ⅔ Average earnings: 51% (ratio to that of men) Women occupy only 2% of parliamentary seats etc. etc. Is Japan an ‘unequal society’ for women?
As the retirement age has been raised from 55 to 64 over the years, elder workers have taken away jobs from the younger generations. Source: e-Stat Database of the Japanese Government Statistical Office
Net burdens of future generation: ¥108 million; 51.4% of their life-time income Note: Based on net payments/receipts through the government of social security (pension, medical/care insurance, etc.). Based on a set of growth, interest rate, and demography assumptions. Source: “Sedai-betsu no Jueki to Futan (Benefits and Burdens by Age Groups) ,” ESRI Discussion Paper Series 217 (June, 2009).
1985: Equal Employment Opportunity Act for Men and Women 1999: Basic Act for Gender-Equal Society The large wage gap still exists between men and women, though it has been gradually narrowing. Discrimination by sex in labor practices was denounced/illegalized by the 1985 Act. Source:Basic Survey of Wage Structure, Ministry of Health, Labor and Welfare
The average female annual income as the ratio to that of male workers has been 50%± despite the various initiatives taken by the government. Source: Results of Survey of Income in Private Sector, National Tax Agency
Note: Male, Female—mainly engaged in work Male/Female side work—engaged in work on the side The rate of female labor participation as their main engagement has been only 30%+. Male labor participation rate has been gradually declining withthe increasing university enrollment ratio from around 15% in 1955 to 50%+ in 2005 (10% in 1955 to 50%+ in 2005 for all students). Source: Basic Survey of Employment Status, Bureau of Statistics, Ministry of Internal Affairs and Communications
Many Japanese women will not/cannot return to their regular jobs after their marriage/childbearing. However, in order to support family finances, many joins the pool of part-time workers later (with much lower hourly wages). Source: Basic Survey of Employment Status, Bureau of Statistics, Ministry of Internal Affairs and Communications
Findings from Happiness Survey in 2010 Women are econo-socially disadvantaged but happier!? % of 7or higher (by age groups) 15-29 yrs: 57% 30-39 yrs: 58% 40-49 yrs: 53% 50-59 yrs: 53% 60-69 yrs: 49% 70- yrs: 51% Average Score Total: 6.46 (n=3,569) Male: 6.20 (n=1,739) Female: 6.70 (n=1,830) (where 10 = "Very happy" and 0 = "Very unhappy”) % of 7 or higher (by gender) Male: 48% Female: 58% The younger, the happier!? Source: Cabinet Office of Japan (2010) “The National Survey on Lifestyle Preferences: People’s Happiness”
… ‘Happiness’, Japanese Style Thank You !