Download
1 / 1
10 likes | 143 Views
Mapping world-wide distributions of marine mammals using a Relative Environmental Suitability (RES) model. I. Introduction Delineation of large-scale geographic ranges of marine mammals is difficult and often subjective (Fig. 1)

E N D
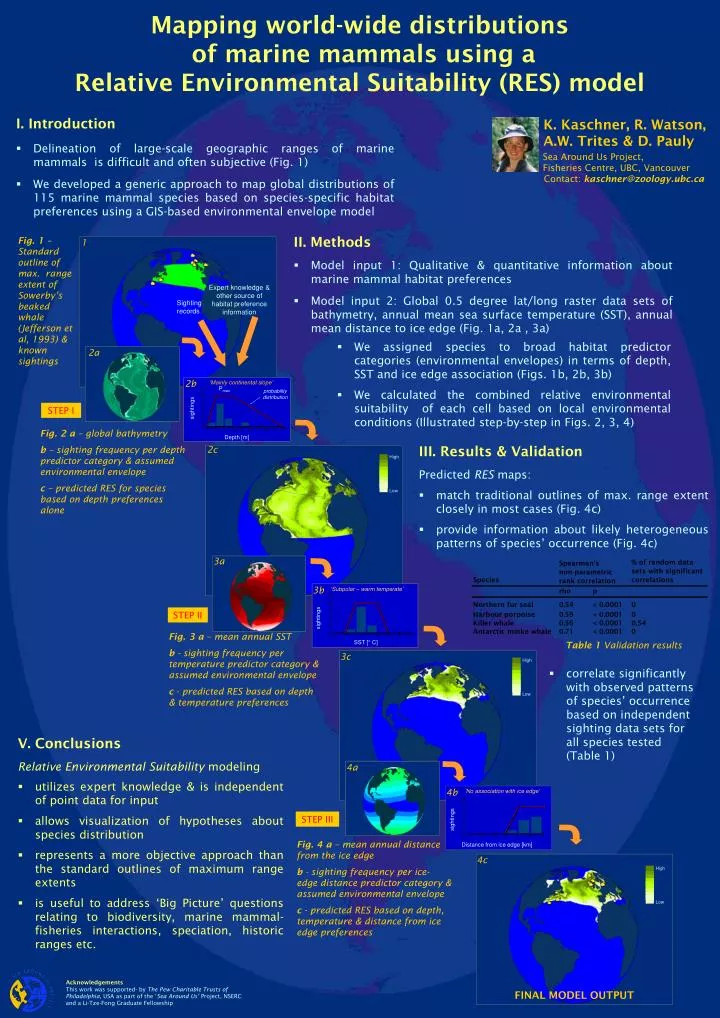
Mapping world-wide distributions of marine mammals using a Relative Environmental Suitability (RES) model • I. Introduction • Delineation of large-scale geographic ranges of marine mammals is difficult and often subjective (Fig. 1) • We developed a generic approach to map global distributions of 115 marine mammal species based on species-specific habitat preferences using a GIS-based environmental envelope model K. Kaschner, R. Watson, A.W. Trites & D. Pauly Sea Around Us Project, Fisheries Centre, UBC, Vancouver Contact: kaschner@zoology.ubc.ca • II. Methods • Model input 1: Qualitative & quantitative information about marine mammal habitat preferences • Model input 2: Global 0.5 degree lat/long raster data sets of bathymetry, annual mean sea surface temperature (SST), annual mean distance to ice edge (Fig. 1a, 2a , 3a) Fig. 1 – Standard outline of max. range extent of Sowerby’s beaked whale (Jefferson et al, 1993) & known sightings 1 Expert knowledge & other source of habitat preference information Sighting records • We assigned species to broad habitat predictor categories (environmental envelopes) in terms of depth, SST and ice edge association (Figs. 1b, 2b, 3b) • We calculated the combined relative environmental suitability of each cell based on local environmental conditions (Illustrated step-by-step in Figs. 2, 3, 4) 2a 2b ‘Mainly continental slope’ Pmax probability distribution STEP I sightings Fig. 2 a – global bathymetry b – sighting frequency per depth predictor category & assumed environmental envelope c – predicted RES for species based on depth preferences alone Depth [m] • III. Results & Validation • Predicted RES maps: • match traditional outlines of max. range extent closely in most cases (Fig. 4c) • provide information about likely heterogeneous patterns of species’ occurrence (Fig. 4c) 2c High Low 3a 3b ‘Subpolar – warm temperate’ STEP II sightings Fig. 3 a – mean annual SST b - sighting frequency per temperature predictor category & assumed environmental envelope c - predicted RES based on depth & temperature preferences SST [° C] Table 1 Validation results 3c High • correlate significantly with observed patterns of species’ occurrence based on independent sighting data sets for all species tested (Table 1) Low V. Conclusions Relative Environmental Suitability modeling 4a • utilizes expert knowledge & is independent of point data for input • allows visualization of hypotheses about species distribution • represents a more objective approach than the standard outlines of maximum range extents • is useful to address ‘Big Picture’ questions relating to biodiversity, marine mammal-fisheries interactions, speciation, historic ranges etc. 4b ‘No association with ice edge‘ C STEP III sightings Fig. 4 a – mean annual distance from the ice edge b - sighting frequency per ice- edge distance predictor category & assumed environmental envelope c - predicted RES based on depth, temperature & distance from ice edge preferences Distance from ice edge [km] 4c High Low Acknowledgements This work was supported- by ThePew Charitable Trusts of Philadelphia, USA as part of the ‘Sea Around Us’ Project, NSERC and a Li-Tze-Fong Graduate Fellowship FINAL MODEL OUTPUT