Download
1 / 22
0 likes | 11 Views
Maize is a vital staple crop in Kenya, serving as a primary source of food and feed. Contamination of maize (Zea mays) by Aspergillus flavus and the subsequent production of aflatoxins pose significant threats to food safety and human health. The risk of A. flavus contamination on imported maize at both gazetted and un-gazetted points of entry has not been extensively studied. The primary objective of this study was to examine the genotypic, phenotypic, and aflatoxigenic traits of A. flavus biovars derived from imported maize at Gazetted and Un-gazetted Points of Entries in Kenya.

E N D
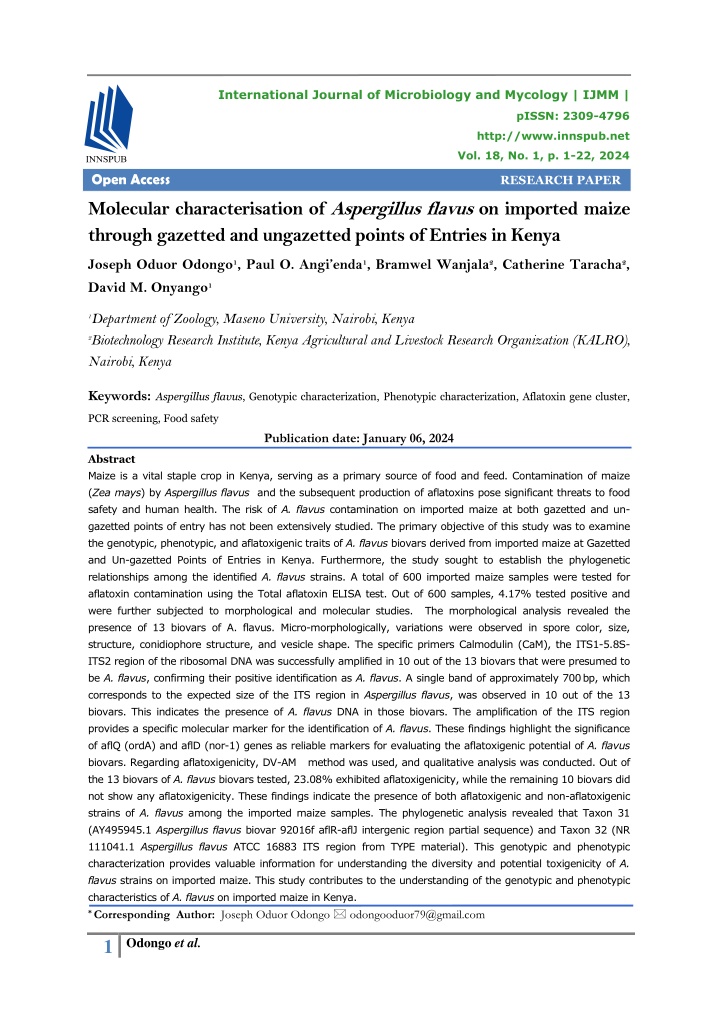
International Journal of Microbiology and Mycology | IJMM | pISSN: 2309-4796 http://www.innspub.net Vol. 18, No. 1, p. 1-22, 2024 Open Access RESEARCH PAPER Molecular characterisation of Aspergillus flavus on imported maize through gazetted and ungazetted points of Entries in Kenya Joseph Oduor Odongo1, Paul O. Angi’enda1, Bramwel Wanjala2, Catherine Taracha2, David M. Onyango1 1Department of Zoology, Maseno University, Nairobi, Kenya 2Biotechnology Research Institute, Kenya Agricultural and Livestock Research Organization (KALRO), Nairobi, Kenya Keywords: Aspergillus flavus, Genotypic characterization, Phenotypic characterization, Aflatoxin gene cluster, PCR screening, Food safety Publication date: January 06, 2024 Abstract Maize is a vital staple crop in Kenya, serving as a primary source of food and feed. Contamination of maize (Zea mays) by Aspergillus flavus and the subsequent production of aflatoxins pose significant threats to food safety and human health. The risk of A. flavus contamination on imported maize at both gazetted and un- gazetted points of entry has not been extensively studied. The primary objective of this study was to examine the genotypic, phenotypic, and aflatoxigenic traits of A. flavus biovars derived from imported maize at Gazetted and Un-gazetted Points of Entries in Kenya. Furthermore, the study sought to establish the phylogenetic relationships among the identified A. flavus strains. A total of 600 imported maize samples were tested for aflatoxin contamination using the Total aflatoxin ELISA test. Out of 600 samples, 4.17% tested positive and were further subjected to morphological and molecular studies. The morphological analysis revealed the presence of 13 biovars of A. flavus. Micro-morphologically, variations were observed in spore color, size, structure, conidiophore structure, and vesicle shape. The specific primers Calmodulin (CaM), the ITS1-5.8S- ITS2 region of the ribosomal DNA was successfully amplified in 10 out of the 13 biovars that were presumed to be A. flavus, confirming their positive identification as A. flavus. A single band of approximately 700 bp, which corresponds to the expected size of the ITS region in Aspergillus flavus, was observed in 10 out of the 13 biovars. This indicates the presence of A. flavus DNA in those biovars. The amplification of the ITS region provides a specific molecular marker for the identification of A. flavus. These findings highlight the significance of aflQ (ordA) and aflD (nor-1) genes as reliable markers for evaluating the aflatoxigenic potential of A. flavus biovars. Regarding aflatoxigenicity, DV-AM method was used, and qualitative analysis was conducted. Out of the 13 biovars of A. flavus biovars tested, 23.08% exhibited aflatoxigenicity, while the remaining 10 biovars did not show any aflatoxigenicity. These findings indicate the presence of both aflatoxigenic and non-aflatoxigenic strains of A. flavus among the imported maize samples. The phylogenetic analysis revealed that Taxon 31 (AY495945.1 Aspergillus flavus biovar 92016f aflR-aflJ intergenic region partial sequence) and Taxon 32 (NR 111041.1 Aspergillus flavus ATCC 16883 ITS region from TYPE material). This genotypic and phenotypic characterization provides valuable information for understanding the diversity and potential toxigenicity of A. flavus strains on imported maize. This study contributes to the understanding of the genotypic and phenotypic characteristics of A. flavus on imported maize in Kenya. * Corresponding Author: Joseph Oduor Odongo odongooduor79@gmail.com 1 Odongo et al.
Introduction (Atehnkeng et al., 2014). Understanding these Maize plays a central role in the food security and interactions can help in the development of livelihoods of Kenyan populations. It serves as a resistant maize varieties and cultural practices staple food crop for a significant portion of the that can limit fungal growth and subsequent population, contributing to both dietary needs aflatoxin production. The population structure and income generation. Moreover, maize is an and genetic diversity of A. flavus strains isolated essential component of livestock feed, supporting from maize play a significant role in aflatoxin the growth of the domestic livestock industry. In contamination and disease development. The sub-Saharan Africa as a whole, maize is ranked existence of multiple strains within the A. flavus third in importance among cereal crops, following population highlights the need for comprehensive rice and wheat (Shiferaw et al., 2011). The investigations to characterize their phenotypic cultivation and trade of maize have a and genotypic traits. Such studies will provide considerable impact on regional economies and insights into the factors influencing aflatoxin food systems. Maize (Zea mays) is often production, the design of effective control contaminated by Aspergillus fungal species during strategies, and the development of resistant pre- and post-harvest practices, storage, and maize varieties to minimize the health and transportation. Studies by Horn (2007) showed economic risks associated with aflatoxin that Aspergillus species are commonly found in contamination. Aspergillus species, including the soil, which acts as a source of primary Aspergillus flavus, are of great concern due to inoculum for infecting developing maize kernels their ability to produce aflatoxins, potent during the growing season. Aspergillus flavus is carcinogens and toxins that contaminate various distributed globally with a high frequency of agricultural commodities, including maize. The occurrence in warm climates which favor the accurate identification and characterization of growth of the fungus (Cotty et al., 1994). Aspergillus species is crucial for assessing their potential to produce aflatoxins and understanding Understanding the population structure and their impact on food safety. genetic diversity of A. flavus is crucial for diversification of effective management Gene sequencing has emerged as a powerful tool strategies. Different strains of A. flavus may have for the accurate identification and classification of varying levels of aflatoxin production and Aspergillus species. In recent years, numerous pathogenicity, which can influence the severity of studies have utilized gene sequencing data to contamination in maize (Abbas et al., 2013). characterize Aspergillus biovars from different Additionally, certain strains may exhibit sources. By comparing the genetic sequences of resistance or susceptibility to control measures, specific genes, such as the internal transcribed such as biological control agents or fungicides. spacer (ITS) region, researchers can determine Therefore, identifying specific strains or groups the species and genetic diversity within a within the A. flavus population can aid in the population. In addition to genetic selection of appropriate control strategies to characterization, a polyphasic approach is minimize aflatoxin contamination. Moreover, the commonly employed to identify and characterize genetic diversity of A. flavus may also have Aspergillus biovars. This approach combines implications for host-pathogen interactions and morphological and molecular analyses to provide disease development. Different strains may a comprehensive understanding of the biovars. exhibit variations in their ability to infect maize Morphological characteristics, such as colony kernels, colonize host tissues, and compete with color, texture, spore color, size and structure, other microorganisms in the maize ecosystem conidiophore structure and vesicle shape are 2 Odongo et al.
observed and recorded. These characteristics associated with higher aflatoxin production, thus enabling the development of targeted control help in differentiating between various Aspergillus strategies. Secondly, it provides insights into the species and subgroups. Furthermore, molecular diversity of A. flavus biovars present in imported techniques, including polymerase chain reaction maize and their potential for aflatoxin (PCR) amplification and sequencing of specific contamination. This knowledge can contribute to genetic markers, allow for a more precise risk assessment and management strategies identification of aflatoxigenic and non- aimed at preventing or minimizing aflatoxin aflatoxigenic A. flavus biovars. These methods contamination in the domestic maize supply target genes associated with aflatoxin production, chain. such as the aflatoxin biosynthesis cluster genes, to determine the potential of a biovar to produce Genotypic characterization involves studying the aflatoxins. The combination of gene sequencing genetic makeup of A. flavus biovars to determine and polyphasic approaches provides a their relatedness, genetic diversity, and potential comprehensive understanding of the genetic for toxin production. Several molecular diversity, population structure, and aflatoxin- techniques have been used for genotyping A. producing potential of Aspergillus species, flavus, including random amplified polymorphic particularly A. flavus. This information is essential DNA (RAPD), amplified fragment length for risk assessment, development of effective polymorphism (AFLP), and multilocus sequence control strategies, and ensuring the safety and typing (MLST) (Abdallah et al., 2018). These quality of imported maize and other agricultural methods have provided valuable insights into the commodities. genetic diversity and population structure of A. flavus, highlighting the presence of distinct This study contributed to the understanding of genotypes in different geographic regions (Klich the population dynamics and potential risks et al., 2015). Phenotypic characterization associated with A. flavus in imported maize. involves studying the observable traits and Given the prominence of maize in Kenya, behaviors of A. flavus, such as growth patterns, research efforts focusing on this crop are crucial. conidiation, and mycotoxin production. The genotypic and phenotypic characterization of Phenotypic characterization is essential for A. flavus on imported maize assumes particular understanding the pathogenicity and virulence of significance in the Kenyan context. A thorough A. flavus strains on imported maize. Researchers understanding of the genetic diversity and have observed variations in colony morphology, potential for mycotoxin production in A. flavus growth rate, and sporulation among different A. populations is essential for developing effective flavus biovars (Calvo et al., 2016). Furthermore, control strategies and mitigating the health risks studies have demonstrated the production of associated with mycotoxin contamination. mycotoxins, particularly aflatoxins, by certain A. Gazetted and un-gazetted points of entry play a flavus strains (Chang et al., 2019). Phenotypic crucial role in facilitating the importation of characterization provides valuable information for maize. However, the risk of A. flavus risk assessment and identifying high-risk A. contamination in imported maize has not been flavus biovars in imported maize. The genotypic thoroughly investigated, warranting a and phenotypic characterization of A. flavus on comprehensive genotypic and phenotypic imported maize plays a crucial role in assessing characterization of this fungus. Understanding the the potential health risks associated with genotypic and phenotypic characteristics of A. mycotoxin contamination. By combining genotypic and phenotypic data, researchers can flavus on imported maize is essential for several identify highly toxigenic A. flavus strains and reasons. Firstly, it allows for the identification of evaluate their prevalence in imported maize. specific genetic traits and phenotypic features 3 Odongo et al.
This information is essential for implementing Sample collection targeted control measures, such as crop The 200 representative samples of the imported maize were obtained from each of the three POEs management strategies, post-harvest making a total of 600 representative samples. interventions, and storage practices, to minimize The maximum weight of 1.0 kg mycotoxin contamination and ensure food safety composite/aggregate sample was taken from (Li et al., 2020). Investigating A. flavus on each maize lot in each consignment. Ground imported maize specifically at gazetted and un- samples of about 25g for each sub sample were gazetted points of entry in Kenya is crucial. used for the aflatoxin levels analyses and the Gazetted points of entry are official border average level calculated. The representative checkpoints designated for the importation of sample was obtained by applying below agricultural products, while un-gazetted points of mentioned standard as stated in KS-ISO13690 entry refer to informal channels through which (KEBS) guideline. The consignment was divided goods, including maize, are smuggled into the into (n - 1) groups containing n or (n - 1) country. Analyzing both types of entry points can bags; the remaining bags constitute a group. provide a comprehensive understanding of the Where n= square root of the total number bags risks associated with A. flavus contamination in in the consignment (n - 1) = rounded down imported maize, as well as the efficacy of control square root of the consignment bags. measures implemented at official checkpoints. In this study, we aim to conduct a detailed Detection of Aspergillus flavus (ELISA) genotypic and phenotypic characterization of A. The HELICA Low Matrix Total Aflatoxin Assay, flavus on imported maize at both gazetted and which utilizes an enzyme-linked immunosorbent un-gazetted points of entry in Kenya. We will assay (ELISA) to accurately measure total analyze the genetic diversity, aflatoxin production capability, and other phenotypic traits of A. flavus aflatoxin levels in maize samples. To extract biovars obtained from imported maize samples. aflatoxin from the ground maize samples, a By doing so, we hope to gain insights into the mixture of 20g sample and 70% methanol potential sources and pathways of A. flavus solvent (ratio 1:5) was vigorously shaken for 5 contamination in imported maize and develop minutes. A 100mL portion of the extraction targeted strategies to ensure the safety and solvent was then transferred to a container and quality of imported maize in Kenya. combined with 20g of the ground sample. The resulting mixture was shaken in a sealed Materials and methods container or for at least 2 minutes. Subsequently, Study sites 5-10mL of the extract was filtered through a The study focused on the three distinct regions, Whatman #1 filter paper to obtain a purified each selected to represent different border sample for analysis. In the assay procedure, each classifications viz. Sio-port as an un-gazetted mixing well was filled with 200µL of Sample border, and Malaba and Busia border as gazetted Diluent. Following that, 100µL of both the borders. The rationale behind the choice of these standard solutions and prepared maize samples specific sites was based on their significant role in were added to the appropriate mixing wells the importation of maize within the study area. containing diluent. The contents were thoroughly Collectively, these regions account for mixed, and 100µL of the resulting mixture from approximately 58% of the total imported maize, each well was transferred to corresponding highlighting their prominence in cross-border Antibody Coated Microtiter Wells. The microtiter trade and their potential influence on the study's plate was incubated at room temperature for 30 findings. 4 Odongo et al.
minutes, after which the liquid was discarded. To Morphological characterization of Aspergillus flavus Biovars ensure proper washing, the wells were filled with Following a 7-day incubation period, the PBS-Tween wash buffer three times, and any macroscopic characteristics of the biovars were residual wash buffer was removed by tapping the examined, including colony growth, color, microtiter plate on absorbent towels. texture, conidia, and reverse color. In accordance Subsequently, 100µL of Aflatoxin HRP-conjugate with the method described by Diba et al. (2007), was added to each antibody-coated well, and the slide cultures were prepared for microscopic plate was incubated for an additional 30 minutes assessment. To create a slide culture, an at room temperature, keeping it covered to 18 × 18 mm cover slip was carefully placed at a prevent exposure to direct light. The Substrate 45° angle on the agar media containing the Solution, measured and placed in a separate inoculated culture. Once the fungus sporulated, container, was then added to each well (1 the cover slip was gently removed and mL/strip or 120µL/well) in a 100µL volume. The transferred to a microscope slide. A drop of plate was covered and incubated for 10 minutes lactophenol cotton blue was added, and a small at room temperature. Finally, 100µL of Stop cover slip was used to cover the drop. Another Solution was added to each well at the same pace drop of lactophenol cotton blue was placed on top as the Substrate Solution. The optical density of the small cover slip, and a 22 × 22 mm cover (OD) of each microwell was determined using a slip was used to complete the assembly. This microtiter plate reader set to 450nm. allowed for microscopic examination of the fungal features, including conidiophores, vesicles, Isolation of Aspergillus flavus Biovars metulae, philiades, conidia shape, and texture. The isolation was carried out in accordance with Abasic biological light microscope equipped with a the method of Samson et al. (2019). The grinded 100x objective and immersion oil was utilized for or milled maize samples were aseptically observations. During the microscopic transferred into a sterile 250ml flask, and 90ml of examination, the samples were analyzed to sterile distilled water was added. The flask was identify the type of hyphae (biserate or then placed on a horizontal shaker and agitated uniserate), the shapes of conidia, and the lengths at a rate of 180 strokes per minute for duration of conidiospores. For accurate identification, a of 30 minutes. Serial dilutions were prepared to suitable mycological atlas was referenced. facilitate microbial analysis. Each dilution involved adding 1ml of the previous dilution to a Dichlorvos-Ammonia (DV-AM) test for sterile 50ml tube, followed by the addition of 9ml aflatoxigenicity of sterile distilled water. The tube was vortexed The DV-AM method begins with the fully grown for 1 minute to ensure thorough mixing. To biovars, which were initially cultured on the assess microbial growth, 0.1ml samples from Czapek Dox Agar medium. These biovars are each serial dilution were inoculated onto Potato then sub-cultured onto the aflatoxin-inducing Dextrose Agar (PDA) growth media. The PDA Yeast Extract Sucrose (YES) medium, which is media composition consisted of 20g dextrose, 4g supplemented with streptomycin sulfate and potato extract, and 15g agar. The inoculated penicillin obtained from Zhonghuo plates were then incubated at a temperature of Pharmaceuticals, China. The sub-culturing process takes place and the biovars are carefully 28°C for duration of 10 days. At the end of the maintained for a period of seven days at a incubation period, the colonies on the PDA plates temperature of 28°C. To prepare the YES were visually examined using the naked eye to medium for cultivation, dichlorvos was diluted determine color and growth rates. 5 Odongo et al.
with methanol at a ratio of 250-fold. This the mixture was incubated in a shaker at 69°C dichlorvos solution was mixed with the media for 20 minutes. Following this, the suspension was centrifuged at 13000 rpm for 15 minutes at prior to its solidification, ensuring that the aflatoxin-inducing properties are effectively 4°C using a temperature-controlled centrifuge. incorporated. The sub-cultured biovars were then The resulting supernatant was transferred to a new tube, and 0.75 ml of 4 M sodium acetate was placed in an environment of darkness and incubated at a temperature of 28°C for duration added to precipitate polysaccharides and proteins of five days. During this incubation period, the at a pH of 5.2. The solution was thoroughly biovars had the opportunity to develop and mixed by inversion and incubated on ice for 20 exhibit their aflatoxigenicity. After the five-day minutes. After centrifuging the solution at 12000 rpm for 20 minutes, the resulting incubation period, an important step is introduced to assess the aflatoxigenicity of the biovars. A supernatant was transferred to a new tube. To precipitate the DNA, 0.175 ml of isopropanol was small quantity of ammonium hydroxide solution, approximately 0.2 mL, was poured onto the gently mixed by inversion with the supernatant inside of the lid of the petri dish plate that was and placed on ice for 15 minutes. The DNA was then pelleted by centrifugation at 13000 rpm for used to set up the DV-AM method. This addition helps facilitate the subsequent evaluation. 15 minutes at 4°C. The resulting pellets were Following the introduction of ammonium washed with 70% ethanol and air-dried by hydroxide, the biovars were carefully observed inverting the centrifuge tube on a paper towel. Once dried, 0.1 ml of TE buffer at a pH of 8 was and categorized based on their ability to produce aflatoxins. A distinct characteristic of added, and the mixture was briefly spun for 10 aflatoxigenic biovars was the appearance of palm minutes. The DNA was finally stored in a red coloration on the underside of the plates, refrigerator at −20°C. indicative of their aflatoxin production. In contrast, non-aflatoxigenic biovars do not display Amplification of Internal Transcribed Spacer this palm red coloration. Region To amplify the partial sequence of the ITS region DNA extraction of the rDNA, the primers Calmodulin (CaM) CMD5 To obtain conidia from A. flavus biovars, a 7-day- Forward (5′-CCG AGT ACA AGG ARG CCT TC-3′) old culture on Potato Dextrose Agar (PDA) media and CMD6 Reverse (5′-CCG ATR GAG GTC ATR was utilized. The conidia were then inoculated ACG TGG-3′) were used (inqaba biotec , South into a 150 ml Potato Dextrose Broth (PDB) in a Africa). These primers were designed based on 250 ml conical flask. The flask was incubated sequence alignments. The PCR reaction was under agitation at 120 rpm for 72 hours at a performed in 25 μl PCR tubes, which contained 2.5 μl of the DNA template, 1.5 μl of each primer temperature of 30°C. Harvesting of the mycelia set, 2.5 μl of reaction buffers, 1 μl of MgCl2, was performed using Whatman filter paper No. 1 0.25 μl of dNTPs, and 0.2 μl of Taq DNA through a filtration process. The harvested mycelial mats were subsequently freeze-dried for polymerase. The amplification process involved 48 hours and stored at a temperature of −80°C an initial denaturation cycle of 5 minutes at 95°C, in a deep freezer. Genomic DNA extraction was followed by 30 cycles of denaturation at 95°C for carried out using a modified version of the 30 seconds, annealing at 58°C for 30 seconds, method described by Diniz et al. (2005). One and extension at 72°C for 45 seconds. A final gram of fresh mycelia was ground into a fine extension cycle of 5 minutes at 72°C was powder using a precooled mortar. A lysis buffer performed. Subsequently, the PCR products were (1.5 ml) was added to the mycelia powder, and held at 4°C and visualized using 1.2% agarose 6 Odongo et al.
gels in TE buffer. A 100 bp DNA molecular ladder reaction was carried out following the was used for comparison. Electrophoresis was manufacturer's protocol. The obtained forward conducted at 80 V for 1 hour, and the gel was and reverse sequences for each sample were visually inspected and edited to remove any low- observed under UV light. The presence of a single band at approximately 700 bp indicated quality regions or ambiguous bases. The edited successful amplification of the ITS region from A. sequences were aligned using a bioinformatics flavus. software tool such as MEGA 11, which utilizes alignment algorithms to ensure accurate PCR purification and sequencing alignment of sequences. A phylogenetic tree was constructed based on the aligned sequences The gel bands were excised under blue light and using MEGA 11. The Maximum Likelihood (ML) subjected to purification using the quick protocol method was used for inferring the evolutionary for DNA gel purification by vacuum, employing the Wizard® SV Gel and PCR Clean-Up System. relationships among the Aspergillus flavus The targeted DNA band was carefully transferred strains. The Tamura-Nei model was chosen as the to a microcentrifuge tube, and 10 μl of membrane best-fit model for nucleotide substitution, and the bootstrap method was employed to assess the binding solution was added. The mixture was support for different branches in the phylogenetic vortexed and incubated at 65°C in a water bath tree. The analysis involved 500 bootstrap until the gel was completely dissolved. replicates to estimate branch support. The Subsequently, the solution was transferred into a obtained sequences were compared to the minicolumn, which was inserted into a microcentrifuge tube. The assembly was existing sequences available in the NCBI incubated at room temperature on the bench for database using tools such as BLAST (Basic Local 3 minutes and then centrifuged at 1600 rpm for 5 Alignment Search Tool). This allowed for minutes. To further purify the DNA, 700 μl of identification and characterization of the strains and comparison of their genetic similarity to membrane wash solution was added to the known sequences. The results of the phylogenetic minicolumn, followed by centrifugation at 1600 rpm for 5 minutes. The flow-through was analysis and sequence comparison to NCBI discarded, and two additional washing steps were sequences were interpreted to understand the performed using 500 μl of membrane wash genetic relationships among the Aspergillus flavus strains, their genetic diversity, and potential solution each time. The column assembly lid was implications in terms of epidemiology, virulence, opened to allow residual ethanol to evaporate on and unique genetic characteristics. the bench. Finally, the purified DNA was eluted from the minicolumn by adding nuclease-free Results water, incubating for 1 minute, and centrifuging Total Aflatoxin ELISA analysis for 2 minutes. For sequencing, the purified DNA The aflatoxin detection on imported maize was sent to the molecular laboratory at the samples was performed using the Total Aflatoxin University of Nairobi. ELISA kit. The below Table 1 represents the results of 30 positive samples obtained from the Phylogenetic analysis analysis of 600 imported maize. The purified PCR products were subjected to Sanger sequencing using the forward and reverse The above Table 1 illustrates the findings of the primers used for PCR amplification. The Sanger 30 positive samples of imported maize from the sequencing reaction mixture contained the three points on entries that were subjected to the purified PCR product, sequencing primers, and a Total aflatoxin analysis. DNA sequencing enzyme. The sequencing 7 Odongo et al.
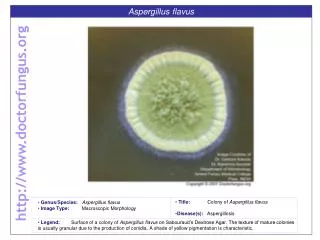
Table 1. Showing moisture content analysis and total AF levels the acceptable range. None of the samples had a moisture content exceeding 13.5%. Therefore, Sample Moisture Content (%) 12.5 11.6 12.0 12.3 12.6 14.7 12.4 12.6 10.6 10.4 10.7 12.0 9.5 11.8 13.0 9.5 11.1 11.3 13.9 12.5 9.3 9.7 11.3 6.9 12.0 6.0 10.9 8.1 7.9 12.3 Total AF- Levels (ppb) 6.096 3.245 0.392 4.873 0.899 27.35 27.13 18.06 26.26 23.92 25.3 25.68 27.97 16.23 27.13 22.86 30.85 30.69 28.05 30.74 27.47 29.37 23.79 20.67 20.82 22.75 18.99 29.68 27.19 17.39 Site the moisture content requirement was met for all the analyzed samples. It was also apparent that AF01 AF02 AF03 AF04 AF05 AF06 AF07 AF08 AF09 AF10 AF11 AF12 AF13 AF14 AF15 AF16 AF17 AF18 AF19 AF20 AF21 AF22 AF23 AF24 AF25 AF26 AF27 AF28 AF29 AF30 SIO-PORT MALABA BUSIA SIO-PORT BUSIA SIO-PORT SIO-PORT SIO-PORT SIO-PORT SIO-PORT SIO-PORT SIO-PORT SIO-PORT SIO-PORT SIO-PORT SIO-PORT MALABA MALABA MALABA MALABA MALABA MALABA BUSIA BUSIA BUSIA BUSIA BUSIA BUSIA BUSIA BUSIA several samples have total aflatoxin levels that exceed the KEBS threshold of 10 ppb. Specifically, samples AF06, AF07, AF08, AF09, AF10, AF11, AF12, AF13, AF15, AF17, AF18, AF19, AF20, AF21, AF22, AF23, AF24, AF26, AF28, and AF29 have total aflatoxin levels exceeding the acceptable limit. Macroscopic morphological features Macrobiotic color was observed on the PDA media after 7 days of incubation (Fig. 1). Based on colonies color approximately 13 biovars were identified out of 30 samples. The colonies typically exhibit a velvety texture and displayed a range of colors, including yellow, green, and brown. The reverse side of the colonies appears golden to red-brown in color. The conidiophores, which are the structures responsible for conidia (asexual spores) production, vary in length and The Total Aflatoxin ELISA Kit was a solid-phase possess a rough, pitted, and spiny surface. The phialides, which are specialized structures direct competitive enzyme immunoassay attached to the conidiophores, were observed as designed for the detection of aflatoxins. This single or double and cover the entire vesicle, assay utilizes a highly specific antibody that has pointing outward in all directions. These distinct been optimized to cross-react with all four macroscopic features aid in the identification and subtypes of aflatoxins, namely aflatoxins B1, B2, characterization of Aspergillus flavus strains. It is G1, and G2. The primary purpose of this kit is to enable the quantitative measurement of aflatoxin important to note that these characteristics levels. It was observed that all the samples listed provided initial insights into the phenotypic in the table have moisture content values within diversity of the Aspergillus flavus strains. Fig. 1. Showing Aspergillus flavus biovars on PDA culture 8 Odongo et al.
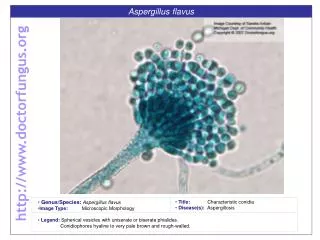
Growth rate of Aspergillus flavus spread of the growth rate values from the mean, was approximately 0.125 on the 3rd day and 0.463 on the 7th day. These values indicate the extent of variation in growth rates among the biovars. The standard deviation, which provides a measure of the dispersion of the growth rate values, was calculated to be approximately 0.353 centimeters on the centimeters on the 7th day. These values indicate the average amount of deviation from the mean growth rate. The lowest growth rate observed in the dataset was 3.4 centimeters, observed on the 3rd day for isolate AF25-D. Conversely, the highest growth rate centimeters, observed on the 3rd day for biovars AF4-A, AF22-B, and AF8-B, as well as on the 7th day for isolate AF22-D. The growth rate of Aspergillus flavus biovars in Malt Agar was analyzed based on the provided data. The measurements of growth rate in centimeters on the 3rd and 7th day were examined to gain insights into the fungal growth patterns (Fig. 2). 3rd day and 0.681 recorded was 8.4 Fig. 2. Showing growth rate of Aspergillus flavus, measured in day 3 and 7 of culturing Microscopic morphological features The microscopic features of A. flavus stained with of lactophenol cotton blue were determined by examination of 13 magnification under light microscope ZeissPrimo Star, coupled to AxioCam ERc 5s camera as shown below; Aspergillus flavus colonies typically exhibit a biseriate arrangement, characterized by philiades extending in all directions from metulae. These metulae, situated on subglobose or globose vesicles of varying sizes, cover the entire surface, making them indistinguishable. The conidia of A. flavus are approximately 250 μm to 450 μm in diameter, assuming a globose shape. The mean growth rate on the 3rd day was approximately 4.046 centimeters, while on the 7th day, it was around 7.930 centimeters. These values represent the average growth rates observed across the different biovars. The median growth rate, which represents the middle value in the data set, was 3.9 centimeters on the 3rd day and 8.3 centimeters on the 7th day. This indicates that approximately half of the biovars exhibited growth rates below these values, while the other half had growth rates above them. The mode, which corresponds to the most frequently occurring growth rate, was observed to be 3.8 centimeters on the 3rd day and 8.4 centimeters on the 7th day. These values suggest that a notable number of biovars exhibited growth rates close to these specific values thus may be closely associated. The variance, a measure of the biovars using X400 They possess thin walls and a rough texture. The conidiophores, which support the conidia, are unbranched and lack pigmentation. They feature a rough texture and have thick walls (Fig. 3). Fig. 3. Showing the microscopic view of biovars of Aspergillus flavus 9 Odongo et al.
Table 2. The microscopic view of Aspergillus flavus biovars Biovars Color Revers e Color White White White White Green White White White White White White White Green/ white Conidia form Conidia Size 54m 54m 54m - - - - 54 - 45m 44m 44m 44m Mycelia Phialides Stipe Heads AF22-D AF6-B AF30-D AF29-C AF4-A AF8-B AF24-D AF17-C AF22-B AF9-C AF25-D AF17-CD AF25-A Green Green Green Brown Black Green Green Green Green Green Green Green Black Round, smooth Smooth, round Round, smooth Smooth, round Round, smooth Round, smooth Round, smooth Round, smooth Smooth, round Round Smooth Round, smooth Smooth, round Smooth, round - Uniserate Biserate Biserate Biserate - Biserate Biserate Biserate Uniserate Biserate Biserate Uniserate Biserate Soft, smooth Soft, septate Soft Soft, septate Soft Soft aseptate Soft, septate Rough, septate Smooth, aseptate Smooth, aseptate Smooth Smooth, aseptate Soft, aseptate Soft Rough Soft Soft, septate Soft Soft Soft Rough Soft Rough Rough Smooth Rough Septate Septate Septate Septate Aseptate Septate Septate - Septate Septate Septate Septate Aseptate: The absence of septa or crosswalls in the hyphae. Aseptate hyphae are multinucleate and allow for unrestricted movement of nutrients and organelles throughout the fungal structure. Septate: The presence of septa or crosswalls dividing the hyphae into distinct cells. Septa provide structural support and regulate the movement of nutrients and organelles between different compartments of the fungus. Uniserate: Describes the arrangement of phialides in a single row along the metulae or conidiophore. The phialides in uniserate growth are aligned in a linear pattern. Biserate: Describes the arrangement of phialides in two rows along the metulae or conidiophore. The phialides in biserate growth are arranged in two parallel rows. Color: Refers to the pigmentation of the fungal colony. The color can vary depending on the species and can be helpful in identification. Reverse Colour: Describes the color observed on the underside or reverse side of the fungal colony. The reverse color can also provide valuable information for species identification. The Table 2 provides detailed information about (YES) medium supplemented with streptomycin the fungal biovars' characteristics in terms of sulfate and penicillin. The sub-cultured biovars aseptate, septate, uniserate, and biserate growth are maintained for seven days at 28°C. The YES patterns, as well as color and reverse color, medium is prepared by mixing dichlorvos, diluted which are important factors in fungal with methanol at a 250-fold ratio, prior to classifications and identification. The microscopic solidification. After sub-culturing and incubating features of the 13 biovars of Aspergillus flavus the biovars in darkness for five days, a small were tabulated as shown below. amount of ammonium hydroxide solution is added to the petri dish plate lids. The biovars are Identification of toxigenic Aspergillus flavus observed, and those that produce aflatoxins strains exhibit distinct palm red coloration on the Thirteen fully grown biovars are cultured on underside of the plates, while non-aflatoxigenic Czapek Dox Agar medium and then sub-cultured biovars do not display this coloration (Fig. 4). onto aflatoxin-inducing Yeast Extract Sucrose Fig. 4. Showing the appearance of Aspergillus flavusbiovars on DV-AM 10 Odongo et al.
According the DV-AM test only three biovars of Aspergillus flavus were aflatoxigenic producing palm red coloration (positive test) following ammonia (AM) treatment. These were A. flavus biovars (AF22-D, AF30-D, and AF24-D). The remaining ten biovars pigmentation thus were (negative test).The intensity of color produced by the biovars on this medium is correlated with their aflatoxin production capability. Intense coloration indicates high aflatoxin production, while weak or no coloration suggests low or no aflatoxin production. had no non-aflatoxigenic palm red Fig. 5. Showing the PCR results as shown on gel electrophoresis Detection of Aspergillus flavus Using PCR Method The polymerase chain reaction (PCR) was Table 3. Results of the dichlorvos-ammonia performed to amplify the internal transcribed (DV-AM) method, moisture content, and total spacer (ITS) region of the fungal DNA extracted aflatoxin levels from the suspected biovars. The ITS region is a Biovars Moisture Content (%) 9.7 12.3 6.9 12.0 12.6 11.3 11.3 12.3 10.6 14.7 6.0 7.9 11.1 Total AF Levels 29.37 17.39 20.67 20.82 18.06 23.79 30.69 4.873 26.26 27.35 22.75 27.19 30.85 DV-AM highly conserved region located between the small subunit (SSU) and large subunit (LSU) AF22-B AF30-D AF24-D AF25-D AF8-B AF22-D AF17-CD AF4-A AF9-C AF6-B AF25-A AF29-C AF17-C Table 3 demonstrates that the biovars, AF22-B exhibited a moisture content of 9.7% and total aflatoxin levels of 29.37 ppb, resulting in a positive DV-AM test (+), indicating the presence of aflatoxigenic gene production. On the other hand, AF30-D, and AF24-D, showed moisture contents of 12.3%, and 6.9%, respectively, and total aflatoxin levels of 17.39 ppb, and 20.67 ppb, respectively. These biovars received DV-AM results of +++, indicating a higher intensity of aflatoxigenic gene production. The other biovars exhibited negative DV-AM results, suggesting the absence of aflatoxigenic gene production despite some having high total aflatoxin levels that surpassed threshold Assessing the presence aflatoxigenic genes is crucial to determine the aflatoxin production potential of the biovars, as high aflatoxin levels alone do not necessarily imply aflatoxigenic capability. + +++ +++ − − − − − − − − − − rRNA genes. A single band of approximately 700 bp characteristic of A. flavus amplified ITS region was observed on 10 biovars out of the 13 suspected biovars (Fig. 5). This indicates the presence of A. flavus DNA in those biovars. The amplification of the ITS region provides a specific molecular marker for the identification of A. flavus. There were no bands formed on biovars AF4-A, AF17-C, and AF25-A showing that these biovars did not contain DNA from A. flavus. Phylogenetic analysis of Aspergillus flavus A phylogenetic tree was constructed using MEGA 11 software to analyze the aligned sequences and elucidate the evolutionary relationships among the different Aspergillus flavus strains (Figs 6&7). The Maximum Likelihood (ML) method was employed to infer these relationships, taking into account the Tamura-Nei model as the most suitable model for nucleotide substitution. To evaluate the robustness of the tree, the bootstrap method with 500 replicates was utilized to assess branch support. To further investigate the genetic of 10ppb or standards. absence identity and relatedness of the Aspergillus flavus of strains, the obtained sequences were compared to existing sequences in the NCBI database using the BLAST (Basic Local Alignment Search Tool) tool. This comparative analysis facilitated the 11 Odongo et al.
identification, characterization, and determination of genetic similarity between the strains and known sequences. The results of the phylogenetic analysis, combined with the comparison to NCBI sequences, provided valuable insights into the genetic relationships among the Aspergillus flavus strains, as well as their genetic diversity. These findings carry potential implications in terms of understanding epidemiology, virulence, and the Fig. 6. Phylogenetic tree of the 13 Biovars of Aspergillus flavus presence of unique genetic characteristics within the strains. Fig. 7. Phylogenetic tree of the 13 Biovars in reference to NCBI strains of Aspergillus flavus The phylogenetic analysis of the Aspergillus reported in the 2004 and 2005 growing seasons. These outbreaks affected 317 individuals, flavus strains based on the ITS region sequences resulting in 125 deaths (Kilonzo-Nthenge et al., revealed the evolutionary relationships among 2019). Furthermore, infants are particularly the strains. vulnerable to high levels of aflatoxin exposure due to the consumption of maize and sorghum- Discussion Aflatoxin production poses a significant threat to based diets, as well as aflatoxin MF1 (AFMI) food security, particularly in Kenya. The ingestion through animal milk and breast milk. This levels of aflatoxins, susceptibility to their effects, indicates that aflatoxin contamination starts early age, gender, and duration of exposure are factors in life and continues into adulthood (Atehnkeng et that determine whether households are exposed al., 2014). These findings emphasize the to acute or chronic aflatoxicosis. Studies have importance of being vigilant in identifying the shown that both acute and chronic cases have causes of aflatoxin contamination, implementing occurred in Kenya, with severe outbreaks mitigation strategies and implementing effective 12 Odongo et al.
control measures. At the points of entry into the levels of aflatoxins indicates that other factors, such as agricultural practices, storage conditions, country, regulatory agencies such as the Kenya and transportation, contribute to aflatoxin Bureau of Standards (KEBS), Agriculture and contamination. These findings are consistent with Food Authority (AFA), Port Health, Kenya Plant previous research studies that have highlighted Health Inspectorate Service (KEPHIS), and the need for comprehensive aflatoxin control National Biosafety Authority (NBA) play a crucial strategies beyond moisture content regulation. It role in ensuring the safety of imported food and is crucial to implement measures that encompass animal feeds. Specifically, for aflatoxin control, good agricultural practices, proper storage moisture content and total aflatoxin levels are the facilities, and effective monitoring systems to primary indicators used to test maize before it mitigate aflatoxin contamination in maize and enters the country. KEBS has set permissible ensure food safety (Kilonzo-Nthenge et al., 2019; levels, with moisture content required to be Odhiambo et al., 2020). While the tested samples below 13.5% and total aflatoxin levels below 10 of imported maize met the moisture content ppb, in accordance with their standards requirement, exceeding total aflatoxin levels (Odhiambo et al., 2020). These regulations and indicate the need for a multifaceted approach to testing procedures are in line with previous aflatoxin analysis and control. Future research research studies conducted in Kenya and other should focus on exploring the various factors countries, which have highlighted the importance contributing to aflatoxin contamination in of moisture content and aflatoxin levels as critical imported maize and developing comprehensive parameters for assessing food safety. For strategies to mitigate the risks associated with example, studies by Kilonzo-Nthenge et al. aflatoxin exposure. (2019) and Odhiambo et al. (2020) have examined the impact of aflatoxins on food safety The total aflatoxin ELISA kit used in the research and proposed regulations to mitigate aflatoxin demonstrated that ELISA can process a large contamination. number of samples in a relatively short time, making it a faster option for high-throughput The findings of this study indicate that the tested analysis. On the other hand, PCR, though slower, samples of imported maize meet the moisture offers a multiplexing capability, allowing content requirement, with all values falling below simultaneous detection of various aflatoxin types the threshold of 13.5%. This aligns with previous in a single reaction. This advantage reduces the research studies that have emphasized the overall time and cost for aflatoxin analysis importance of controlling moisture content in compared to running separate ELISA tests for maize to prevent aflatoxin contamination different aflatoxin types. It has also been noted (Kilonzo-Nthenge et al., 2019; Odhiambo et al., that in this research that PCR exhibits superior 2020). Moisture content plays a crucial role in sensitivity with the ability to detect aflatoxin at influencing fungal growth and aflatoxin low levels, often reaching picogram or femtogram production, as high moisture levels provide a levels (Zhang et al., 2012). Conversely, ELISA favorable environment for fungal proliferation. typically has a higher detection limit in the However, it is important to note that moisture nanogram range, making it less suitable for the content alone cannot be solely relied upon as a detection of aflatoxin at lower concentrations. determinant for aflatoxin analysis in imported ELISA detects aflatoxins by utilizing specific maize. This is because total aflatoxin levels were antibodies that bind to aflatoxin molecules. found to exceed the permissible limits in the Despite its high specificity, ELISA can sometimes analyzed samples. Despite meeting the moisture produce false-negative or false-positive results content requirement, the presence of elevated 13 Odongo et al.
due to cross-reactivity with other compounds or Morphological characterization is a widely utilized method for the isolation and characterization of matrix effects in the sample (Maragos, 2009). fungi. It involves the cultivation of fungal PCR, on the other hand, targets the unique specimens on specific growth media to facilitate genetic sequences of aflatoxin-producing fungi, their growth and enable the observation of their ensuring higher specificity and reduced chances macroscopic and microscopic features. Previous of false results (Zhang et al., 2012) thus both research studies have employed various growth methods offer unique advantages and limitations, media, including malt extract agar (MEA), but PCR has emerged as a more effective tool sabouraud dextrose agar (SDA), rose bengal due to its higher sensitivity, specificity, and chloramphenicol agar (RBCA), czapek dox agar ability to identify multiple aflatoxin types (CZA), and potato dextrose agar (PDA), to simultaneously. support the establishment of fungal colonies and enable comprehensive assessment. Aspergillus flavus, belonging to the genus Aspergillus, encompasses a vast group of over In this study, potato dextrose agar (PDA) was 100 identified species. These species employed as the growth medium due to its ability demonstrate robust growth on commonly used synthetic or semi-synthetic media. Among the to provide optimal conditions for the growth and extensive Aspergillus genus, approximately 50 sporulation of the fungi under investigation. PDA species have been documented to produce has been widely utilized in previous research various toxic metabolites. To differentiate fungal studies for fungal cultivation and has biovars, the growth rate is often utilized as an demonstrated satisfactory results in terms of important parameter. Growth rate refers to the colony establishment and development of speed at which a fungus expands its colony under characteristic features (Barnett et al., 2016; specific conditions. It serves as a valuable Samson et al., 2014). The use of PDA in this indicator for comparing and characterizing study allowed for adequate growth and different fungal species or biovars. In the study of sporulation of the fungal biovars, enabling the fungal growth rate, various growth media can be researchers to conduct a thorough evaluation of employed, such as Malt Agar, which provides a their macroscopic and microscopic characteristics. favorable nutrient-rich environment for fungal The macroscopic features, such as colony growth. The growth rate is typically determined morphology, color, and texture, along with the by measuring the colony diameter or area at specific time points, such as on day 3 and day 7 microscopic features, including spore size, shape, of incubation. The growth rate calculation and arrangement, were assessed to aid in the involves dividing the increase in colony diameter identification and classification of the fungal or area by the time interval. This results in a biovars (Samson et al., 2014; White et al., growth rate value expressed in millimeters per 2015). By employing PDA as the growth medium, day or square millimeters per day. By comparing this study ensured that the fungal biovars growth rates among different fungal biovars, received the necessary nutrients and researchers can identify variations in growth environmental conditions to exhibit their patterns and differentiate between species or characteristic morphological traits. This approach strains. Different factors can influence the growth is consistent with previous research studies that rate of fungal biovars, including temperature, pH, have utilized appropriate growth media to nutrient availability, and other environmental support fungal growth and enable accurate conditions. Consequently, growth rate analysis morphological characterization (Barnett et al., provides valuable insights into the adaptability 2016; Samson et al., 2014). and competitiveness of fungal species or biovars. 14 Odongo et al.
Descriptive taxonomic keys were employed as the Although morphology-based taxonomical keys serve as the initial criteria for isolation and primary criteria for fungal isolation, assisting in identification, they have inherent limitations and the selection of presumptive A. flavus biovars. may not always yield accurate results for precise The initial colony growth exhibited a white identification of target fungal biovars. Therefore, mycelium that extended radially, eventually it becomes crucial to employ comprehensive covering the entire surface of the growth molecular approaches, such as PCR-based medium. As sporulation commenced, the colony methods, gene expression analysis, and sequence color transitioned from white to a yellowish green analysis, for further differentiation and or dark green hue, originating from the center classification of fungal groups or sections. and gradually spreading outward to encompass Previous research studies have also emphasized the entire surface. The colonies observed in this the significance of molecular techniques in fungal study displayed a velvety to woolly texture, often identification and classification. These methods enable a more detailed and accurate assessment with a floccose center and a cream color on the of genetic variations, facilitating the distinction reverse side. The identification of these biovars between closely related species and providing a as members of the Aspergillus genus was more comprehensive understanding of fungal confirmed based on the presence of diversity (Xu, 2016; Bensch et al., 2018). By conidiophores, a characteristic feature of incorporating molecular analyses, researchers can Aspergillus spp. However, the conidiophores overcome the limitations of morphological-based observed in this study exhibited a rough texture identification and achieve a more robust and and were unbranched. This deviation in reliable taxonomic classification. conidiophore characteristics may be attributed to various factors such as genetic variation, Aspergillus flavus is a filamentous fungus known environmental conditions, or specific strain for its ability to produce the highly toxic variations within the Aspergillus genus. Previous secondary metabolite called aflatoxin. Aflatoxin is research studies have also reported variations in a potent carcinogen and poses significant risks to human and animal health. The production of conidiophore morphology among different aflatoxin by A. flavus is influenced by various Aspergillus species and strains (Amaike and factors, including the strain's genetic makeup. Keller, 2011; Samson et al., 2014). These Aflatoxin production in A. flavus is controlled by a findings emphasize the importance of considering cluster of genes known as the aflatoxin both common and variable features in biosynthesis gene cluster. This cluster contains morphological characterization for accurate several genes responsible for different steps in identification and classification of fungal biovars. the aflatoxin biosynthetic pathway. The key genes involved in aflatoxin production include: The vesicles observed in this study exhibited a aflR: This gene encodes a transcription factor that subglobose to globose shape and displayed acts as a master regulator of aflatoxin variations in diameter. They were characterized biosynthesis. It controls the expression of other by the presence of biseriate sterigmata or genes in the cluster and is essential for aflatoxin phialides that radiated from all sides. The production. nor-1: This gene encodes an enzyme metulae, on the other hand, were borne on the called norsolorinic acid reductase, which catalyzes vesicles, with the phialides emerging from them. the conversion of norsolorinic acid to averantin, The conidia, which were globose, thin-walled, and an important intermediate in aflatoxin slightly roughened, were found to vary in size biosynthesis. ver-1: This gene encodes an and were borne on the tips of the phialides. enzyme called versicolorin A dehydrogenase, 15 Odongo et al.
which converts versicolorin A to versicolorin B, aflatoxin biosynthesis. This gene encodes an another crucial intermediate in aflatoxin enzyme responsible for the conversion of production. omtA: This gene encodes an O- norsolorinic acid to averantin, a key intermediate methyltransferase enzyme responsible for the in aflatoxin production (Liang et al., 2015). methylation of sterigmatocystin, a precursor Studies have demonstrated a strong association molecule in aflatoxin biosynthesis, to form between the presence of intact aflD (nor-1) gene aflatoxin B1. These genes, along with other and aflatoxin production in A. flavus biovars regulatory and accessory genes within the (Liang et al., 2015). Therefore, the detection of cluster, work together to facilitate the production aflD (nor-1) gene sequences can serve as an of aflatoxin. Different biovars of A. flavus may effective marker to identify aflatoxigenic strains have variations in these genes, leading to of A. flavus. These findings highlight the differences in their ability to produce aflatoxin. significance of aflQ (ordA) and aflD (nor-1) genes Some strains of A. flavus are highly aflatoxigenic, as reliable markers for evaluating the meaning they have a high capacity to produce aflatoxigenic potential of A. flavus biovars. aflatoxin while others may be non-aflatoxigenic Incorporating molecular detection methods or have reduced aflatoxin production. targeting these genes can aid in the rapid and accurate identification of aflatoxigenic strains, Identifying aflatoxigenic strains of A. flavus is enabling effective monitoring and control of important for food safety and agricultural aflatoxin contamination in agricultural and food practices. By understanding the genetic basis of production systems. The presence of high aflatoxin production and using appropriate aflatoxin levels in maize samples does not screening methods, it becomes possible to detect necessarily indicate the maize is aflatoxigenic. and monitor aflatoxigenic strains, implement Aflatoxin production in Aspergillus flavus is control measures, and mitigate the risks mediated by specific genes involved in the associated with aflatoxin contamination in food biosynthesis pathway. Two key genes involved in and feed. According to earlier research, aflQ aflatoxin biosynthesis are aflQ (ordA) and aflD (ordA) and aflD (nor-1) have been proposed as (nor-1) (Yu et al., 2004). These genes encode ideal markers to assess the aflatoxigenic potential enzymes responsible for different steps in the of Aspergillus flavus (Yu et al., 2011; Liang et al., aflatoxin production process. Even though high 2015). These genes play crucial roles in the aflatoxin levels may be detected in the maize biosynthesis of aflatoxin, a highly toxic secondary samples, it is important to determine whether the metabolite produced by A. flavus. biovars possess the necessary genetic machinery for aflatoxin production. The presence of The aflQ (ordA) gene encodes an oxidoreductase aflatoxigenic genes is indicative of the biovars' enzyme involved in the conversion of norsolorinic ability to produce aflatoxins, while their absence acid to averufin, an intermediate compound in suggests the lack of aflatoxin production aflatoxin biosynthesis (Yu et al., 2011). Studies potential. Using the specific primers Calmodulin have shown that the presence of intact aflQ (CaM) CMD5 Forward (5′-CCG AGT ACA AGG ARG (ordA) gene correlates positively with aflatoxin CCT TC-3′) and CMD6 Reverse (5′-CCG ATR GAG production in A. flavus biovars (Yu et al., 2011). GTC ATR ACG TGG-3′), the ITS1-5.8S-ITS2 Detection of aflQ (ordA) gene sequences can region of the ribosomal DNA was successfully therefore serve as a reliable indicator of the amplified in 10 out of the 13 biovars that were aflatoxigenic potential of A. flavus strains. presumed to be A. flavus, confirming their Similarly, the aflD (nor-1) gene, also known as positive identification as A. flavus. These primers norsolorinic acid reductase, plays a crucial role in are designed to target a more variable region 16 Odongo et al.
within the ITS and specifically amplify the target rRNA genes, exhibits high sequence variability sequence of A. flavus. The absence of among fungal species (Brown et al., 2005). The amplification in the other four biovars suggests primers CMD5 Forward and CMD6 Reverse were that their genomic DNA may belong to other designed based on conserved regions flanking the genera or members within the Aspergilli section ITS region and have previously been used for the Flavi that bear close morphological resemblance identification of A. flavus (Jones et al., 2012). By to A. flavus. While morphological characteristics targeting the ITS region, these primers enable and amplification of the ITS sequence of the the amplification of A. flavus-specific DNA rDNA can aid in distinguishing A. flavus from fragments, ensuring accurate and reliable results. other Aspergilli, it presents challenges in The successful amplification of the ITS region in differentiating it from A. oryzae, as these two the suspected biovars further supports their fungi share similar morphological features. To classification as A. flavus. This molecular overcome this problem, the expression of technique has been widely adopted and has aflatoxin biosynthetic genes at the mRNA level contributed to research on the genetic diversity can be employed as a discriminating factor, as and population dynamics of A. flavus (Smith et these genes have been found to be silent in A. al., 2018; Miller et al., 2016). the amplification of oryzae. Previous research studies have the ITS region using CMD5 Forward and CMD6 highlighted the utility of gene expression analysis Reverse primers confirms the presence of A. in distinguishing between A. flavus and A. oryzae. flavus in the suspected biovars, aligning with By examining the expression patterns of aflatoxin previous studies (Jones et al., 2012; Miller et al., biosynthetic genes, such as aflatoxin regulatory 2016). This molecular approach provides a genes (aflR, aflS, aflJ) and structural genes (aflD, valuable tool for the rapid and accurate aflC, aflP), it is possible to differentiate between identification of A. flavus, facilitating further the two species (Yu et al., 2011; Yu et al., 2013). research on its genetic diversity and population This approach offers a more reliable and accurate dynamics (Smith et al., 2018; Lee et al., 2019). method for species discrimination, particularly The phylogenetic analysis provides a visual when morphological characteristics alone are representation of the evolutionary relationships insufficient. The presence of the characteristic among the Aspergillus flavus strains based on the 700 bp band confirms the molecular identity of ITS region sequences. The tree allows for the the biovars as A. flavus. This result suggests that identification of closely related strains, the these biovars share common genetic sequences detection of genetic diversity, and the in the ITS region, which is specific to A. flavus assessment of genetic distances between and distinguishes it from other fungal species. different taxa. These findings contribute to our The ITS region is commonly used in molecular understanding of the genetic diversity and relatedness of Aspergillus flavus strains and can identification and phylogenetic analysis due to its high sequence variability among different fungal have implications for various fields such as species. The successful amplification of the ITS epidemiology, ecology, and pathogenicity studies. region in these biovars supports their The phylogenetic analysis revealed that Taxon 31 classification as A. flavus. The internal (AY495945.1 Aspergillus flavus isolate 92016f transcribed spacer (ITS) region of the ribosomal aflR-aflJ intergenic region partial sequence) and DNA (rDNA) in the suspected biovars of Taxon 32 (NR 111041.1 Aspergillus flavus ATCC Aspergillus flavus was amplified using the specific 16883 ITS region from TYPE material) are the closest relatives to our 12 Aspergillus flavus primers CMD5 Forward and CMD6 Reverse (Smith et al., 2018). The ITS region, located between biovars, as indicated by their very small branch the small subunit (SSU) and large subunit (LSU) length in the phylogenetic tree. 17 Odongo et al.
This finding suggests a high degree of genetic from Taxon 38 (06 CMD F D01 Aspergillus flavus similarity between these biovars and the AF-B, 04 CMD F C01 Aspergillus flavus AF-B) with reference sequences of Taxon 31 and Taxon 32. a moderate branch length. This indicates that taxon 39 shares a common ancestor with Taxon The phylogenetic tree provides insights into the 38, but some genetic divergence has occurred. genetic diversity and relatedness of the samples. Taxa 42 and 43 show a significant difference in The tree consists of 30 taxa {30-60 taxon} (10 branch length, suggesting a considerable genetic reverse, 10 forward and 10 reference sequences divergence. Taxon 42 (02 CMD F A01 Aspergillus form NCBI samples), represented by their flavus AF-B) branches off from Taxon 43 (41, 07 respective IDs. The branch lengths in the tree CMD F E01 Aspergillus flavus AF-B) with a represent the genetic distances between the relatively long branch length. Taxa 44, 47, and taxa. Each taxon is labeled with a description, 48 form a cluster, where Taxon 47 (MZ686705.1 which includes information about the source or Aspergillus flavus strain FMB 0222.1 aflR-aflJ origin of the sample and the sequences intergenic spacer region partial sequence) associated with it. The tree shows the clustering branches off from Taxon 44 (AY566564.1 of related taxa based on their genetic similarity. Aspergillus flavus strain NRRL 3357 norB-cypA Taxon 31 (AY495945.1 Aspergillus flavus isolate region genomic sequence) with a shorter branch 92016f aflR-aflJ intergenic region partial length. Taxon 48 branches off from Taxon 47 sequence) and Taxon 32 (NR 111041.1 with a relatively long branch length, indicating Aspergillus flavus ATCC 16883 ITS region from some genetic divergence. Taxa 50 and 51 show a TYPE material) exhibit very similar branch substantial difference in branch length, lengths, indicating a high degree of similarity in suggesting a significant genetic divergence. their ITS region sequences. This suggests that Taxon 50 (L27433.1 Aspergillus flavus alcohol these two strains are closely related and likely dehydrogenase (adh1) gene promoter region) share a common ancestor. Taxa 33, 34, and 35 branches off from Taxon 51 (07 CMD R E05 form a cluster where Taxon 33 is the closest Aspergillus flavus AF-B) with a relatively long relative to Taxon 32. This implies that Taxon 33 branch length. Taxa 46 (JQ435497.1 Aspergillus (11 CMD F H01 Aspergillus flavus AF-B) and flavus strain V5F-13 aflatoxin gene cluster Taxon 34 (12 CMD R A07 Aspergillus flavus AF-B) breakdown and translocation region genomic share a common ancestor with Taxon 32. sequence) and 47 (MZ686705.1 Aspergillus flavus However, Taxon 35 (JQ946646.1 Aspergillus strain FMB 0222.1 aflR-aflJ intergenic spacer flavus strain CASMB-SEF16 18S ribosomal RNA region partial sequence) share a common gene internal transcribed spacer 1 5.8S ribosomal ancestor (Taxon 44) but have diverged with a RNA gene internal transcribed spacer 2 and 28S moderate branch length. Taxon 56 (13 CMD R ribosomal RNA gene region) has a slightly longer B07 Aspergillus flavus AF-B) and Taxon 54 (11 branch length, indicating some genetic CMD R H05 Aspergillus flavus AF-B) share a divergence. Taxa 36, 37, and 40 share a similar recent common ancestor (Taxon 53) and show a pattern. Taxon 37 branches off from Taxon 40 close relationship. Taxa 55 (09 CMD R G05 (08 CMD F F01 Aspergillus flavus AF-B) with a Aspergillus flavus AF-B) and 58 (06 CMD R D05 very short branch length, indicating a high degree Aspergillus flavus AF-B) have a very short branch of similarity. Taxon 36 (09 CMD F G01 Aspergillus length, indicating high genetic similarity. Taxon flavus AF-B) branches off from Taxon 37 with a 59 (49 and 48) represents a cluster of taxa with a slightly longer branch length, suggesting a small slightly longer branch length, suggesting some genetic difference. Taxa 38 and 39 are closely genetic divergence within the cluster. The small related, with Taxon 39 (37 and 36) branching off branch length signifies that these biovars share a 18 Odongo et al.
fungal identification approaches in ongoing recent common ancestor with Taxon 31 and random sampling and analysis of suspected food Taxon 32, indicating a close evolutionary products. By employing a comprehensive fungal relationship (Brown et al., 2010). This high identification strategy, which combines genetic similarity suggests that the 12 Aspergillus morphological characterization, molecular flavus biovars in our study likely belong to the techniques, and gene expression analysis, it is same species, Aspergillus flavus, based on their possible to accurately identify aflatoxigenic phylogenetic placement. biovars and assess their potential for mycotoxin production. Previous research studies have This finding aligns with a previous research study emphasized the significance of reliable fungal conducted by Johnson et al. (2015), which identification in combating mycotoxin investigated the genetic diversity and relatedness contamination. By implementing robust of Aspergillus flavus biovars using molecular identification methods, such as molecular markers. Their study demonstrated that biovars techniques including PCR-based methods and with small branch lengths in the phylogenetic tree gene expression analysis, researchers and exhibit high genetic similarity and are more regulatory bodies can effectively detect and closely related at the molecular level. Moreover, monitor aflatoxigenic fungi in food products (Raju Taxon 31, represented by the partial sequence of et al., 2014; Yu et al., 2018). This proactive the aflR-aflJ intergenic region, has been approach allows for timely intervention and the previously identified as a key regulatory region implementation of appropriate mitigation involved in the biosynthesis of aflatoxins, a measures to safeguard public health. In potent group of mycotoxins produced by conclusion, the identification and characterization Aspergillus flavus (Yu et al., 2016). This indicates of aflatoxigenic fungi, particularly within the that Taxon 31, along with its high genetic Aspergillus genera, require an integrated and similarity to our biovars, might possess similar multidisciplinary approach. The successful aflatoxin production potential. The reference isolation of toxigenic A. flavus biovars in this sequence of Taxon 32 corresponds to the ITS study underscores the importance of accurate region, which is a widely used molecular marker fungal identification for effective mycotoxin for species identification and phylogenetic control. Continuous random sampling and analysis in fungi (White et al., 1990). Its analysis of suspect food products using similar presence in Taxon 32 and the close similarity of identification approaches are recommended to our biovars to this reference sequence further ensure the ongoing surveillance and prevention of support their classification as Aspergillus flavus. mycotoxin contamination. Identification of fungi within the Aspergillus Acknowledgments genera poses a complex challenge that The authors express their gratitude to the necessitates an integrated approach to achieve management of Kenya Agricultural and Livestock reliable identification and characterization of Research Organization (KALRO), Biotechnology biovars capable of synthesizing aflatoxins. In this Research Centre, Kabete, and Masen University study, three toxigenic biovars of A. flavus were Zoology Department for their support and successfully cultured and isolated, highlighting facilities during the morphological and molecular the importance of accurate identification of studies. Additionally, the authors acknowledge aflatoxigenic fungi for the development of the University of Nairobi Faculty of Health effective mitigation measures against fungal Sciences Molecular Medicine and Infectious infections and mycotoxin production. To ensure Diseases Laboratory for their assistance with DNA food safety and prevent mycotoxin sequencing. contamination, it is crucial to implement similar 19 Odongo et al.
Conflicts of interest Brown DW. 2005. Phylogenetic Analysis of Zipper-Positive Abdominal Aflatoxin-Producing The authors state no conflicts of interest related Aspergillus Species. Mycologia 97(2), 498-504. to this paper's publication. Brown DW. 2010. Phylogenetic Analysis and References Mycotoxin Production Capability of Aspergillus Abbas HK, Accinelli C, Zablotowicz RM, Abel Section Flavi from Brazil Nuts. Mycologia 102(4), CA, Bruns HA. 2013. Prevalence of aflatoxin and 866-872. fumonisin in corn (maize) and peanut cake from hens laying contaminated eggs destined for Chen ZY, Brown RL, Rajasekaran K, Damann human consumption in Pakistan. Food Additives & KE, Cleveland TE. 2008. Evaluation of Contaminants: Part A, 30(1), 169-180. thermotolerant strains of Aspergillus flavus for DOI:10.1080/19440049.2012.748706 aflatoxin contamination and genetic variation. Journal of Food Protection 71(9), 1909-1914. Abdallah MF, Girgis GN, Khedr AHA, Ali EF, Abdul-Raouf UM. 2018. Genotypic diversity and Diba K, Kordbacheh P, Mirhendi SH, Rezaie antifungal susceptibility of Aspergillus flavus S, Mahmoudi M. 2007. Identification of isolated from maize grains in Egypt. Journal of Aspergillus species using morphological Genetic Engineering and Biotechnology, 16. characteristics. Pakistan Journal of Medical Sciences 23(6), 867. Amaike S, Keller NP. 2011. Aspergillus flavus. Diniz LE, Sakiyama NS, Lashermes P, Annual Review of Phytopathology 49, 107-133. Caixeta ET, Oliveira ACB, Zambolim EM, Zambolim L. 2005. Analysis of AFLP markers Atehnkeng J, Donner M, Ojiambo PS, Ikotun associated to the Mex-1 resistance locus in Icatu T, Sikora RA, Cotty PJ, Bandyopadhyay R. progenies. Crop Breeding And Applied 2014. Biological control agents for managing Technology, 5(4), 387. aflatoxin contamination in groundnut: A review. Agriculture 4(3), 197-217. Johnson LJ. 2015. Genetic Diversity and DOI: 10.3390/agriculture4030197 Population Structure of Aspergillus flavus Isolates from Maize Fields in Three Geographic Regions of Atehnkeng J, Ojiambo PS, Ikotun T, Sikora the United States. Journal of Agricultural and RA, Cotty PJ, Bandyopadhyay R. 2014. Food Chemistry 63(41), 9016-9023. Evaluation of atoxigenic isolates of Aspergillus flavus as potential biocontrol agents for aflatoxin Jones JP. 2012. Molecular identification of in maize. Food Additives & Contaminants: Part A, aflatoxigenic and non-aflatoxigenic Aspergillus species from maize (Zea mays L.). Mycotoxin 31(2), 378-387. Research 28(2), 89-96. Bensch K, Groenewald JZ, Dijksterhuis J, Starink-Willemse M, Andersen B, Summerell Kilonzo RM, Imungi JK, Muiru WM, Lamuka PO, Kuria EN. 2017. Genetic diversity and BA, Shin HD, Dugan FM. 2018. Species and aflatoxin contamination of maize from eastern ecological diversity within the Cladosporium Kenya regions. Journal of Applied Biosciences cladosporioides complex (Davidiellaceae, 114, 11342-11351. Capnodiales). Studies in Mycology 89, 177-301. 20 Odongo et al.
Kilonzo-Nthenge A, Monda E, Okoth S, Raju MVLN, Seetharami Reddi TV, Krishna Makori D. 2019. Aflatoxins and their fate in TG. 2014. Development of a PCR-based method maize and maize-based products in Kenya: A for detection and differentiation of review. Food Control 96, 219-225. Aspergillus flavus and Aspergillus parasiticus. Indian Journal of Microbiology 54(2), 202-206. Kilonzo-Nthenge A, Monda E, Okoth S, Makori D. 2019. Aflatoxins and their fate in Samson RA, Houbraken J, Thrane U, Frisvad maize and maize-based products in Kenya: A JC, Andersen B. 2019. Food and indoor fungi. review. Food Control 96, 219-225. Westerdijk Fungal Biodiversity Institute. Lee T. 2019. Genetic Diversity and Population Samson RA, Houbraken J, Thrane U, Frisvad Structure of Aspergillus flavus Isolates from JC, Andersen B. 2014. Food and Indoor Fungi. Maize in Thailand. Frontiers in Microbiology 10, CBS-KNAW Fungal Biodiversity Centre. 1997. Sobolev VS, Neff SA, Gloer JB, Abbas HK. Liang Y, Yu J, Zhou T. 2015. Improving Aflatoxin B1 Production on Rice by Aspergillus 2009. Characterization of novel volatile flavus and Aspergillus parasiticus through antimicrobials from the molds Aspergillus flavus, Recombination of Cytochrome P450 Enzymes. Aspergillus parasticus, and Aspergillus ochraceus. Scientific Reports 5, 1–10. Toxins 1(1), 3-12. DOI: 10.3390/toxins1010003 https://doi.org/10.1038/srep08260 White TJ. 1990. Amplification and Direct Miller JD. 2016. Structure and Population Sequencing of Fungal Ribosomal RNA Genes for Diversity of Aspergillus flavus from Maize in Phylogenetics. In PCR Protocols: A Guide to Thailand. Toxins 8(12), 368. Methods and Applications (pp. 315-322). Academic Press. Odhiambo BO, Kilonzo RM, Njage PM, Okoth S. 2020. Aflatoxin contamination in maize: Xu J, Chen AJ, Zhang Y. 2016. Molecular Current challenges and potential opportunities for approaches for rapid identification and diversity mitigation in Sub-Saharan Africa. Toxins 12(10), assessment of foodborne spoilage yeasts: A 630. review. Journal of Food Science 81(1), M15-M22. Ojiambo PS, Ikotun T, Leke W, Sikora R, Mukalazi J. 2016. Variation in the pathogenic Yu J. 2016. Regulation of Aflatoxin Biosynthesis: and genetic diversity among isolates of Perspectives from Genomics Research. Methods Aspergillus flavus link to aflatoxin contamination in Molecular Biology 1398, 267-285. of peanut and maize in Kenya. Yu J, Chang PK, Cary JW, Wright M, Probst C, Schulthess F, Cotty PJ. 2010. Bhatnagar D, Cleveland TE, Payne GA. 2012. Impact of Aspergillus section Flavi community Comparative mapping of aflatoxin pathway gene structure on the development of lethal levels of clusters in Aspergillus parasiticus and Aspergillus aflatoxins in Kenyan maize (Zea mays). Journal flavus. Applied and Environmental Microbiology, of Applied Microbiology 108(2), 600-610. 78(23), 7856-7866. DOI: 10.1128/AEM.01959-12 DOI: 10.1111/j.1365-2672.2009.04432.x 21 Odongo et al.
Yu J, Chang PK, Ehrlich KC, Cary JW, Yu J, Payne GA, Nierman WC, Machida M, Bhatnagar D, Cleveland TE, Payne GA. 2004. Bennett JW, Campbell BC. 2013. Aspergillus Clustered pathway genes in aflatoxin flavus genomics: Gateway to human and animal biosynthesis. Applied and Environmental health, food safety, and crop resistance to Microbiology 70(3), 1253-1262. diseases. In Advances in Applied Microbiology 84, 1-91. Yu J, Chang P-K, Ehrlich KC, Cary JW, Montalbano B, Dyer JM, Bhatnagar D, Cleveland TE, Payne GA. 2011. Clustered pathway genes in aflatoxin biosynthesis. Applied and Environmental Microbiology 77(24), 8479- 8484. https://doi.org/10.1128/AEM.06367-11 22 Odongo et al.