Download
1 / 27
270 likes | 291 Views
Discover the fundamentals of graphing in robotics, including types of graphs, parts of a graph, and graphing best practices. Learn how to communicate data effectively through tables and graphs, create appropriate graphs based on data, and apply the TAILS method for graph optimization. Practice creating line and bar graphs to represent different types of variables in robotics experiments. Summary and additional resources provided for enhanced learning.

E N D
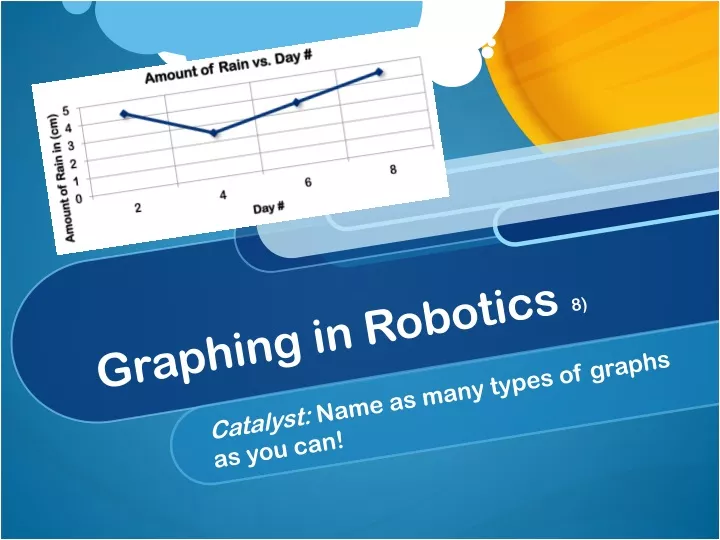
Graphing in Robotics 8) Catalyst: Name as many types of graphs as you can!
Agenda • Graphing in Robotics • Graphing Practice
Useful Abbreviations • Manipulated Variable (MV) – The variable in the investigation that is being changed. • Responding Variable (RV) – The variable in the investigation that is being measured. • TAILS – Title, Axes, Intervals, Labels, Scale
Objective • NGSS (1) Communicate data through tables and graphs. (2) Create appropriate graphs based on data.
What are the parts of a graph? Title Y-axis X-axis
What are the parts of a graph? X-axis = MV
What are the parts of a graph? Y-axis = RV X-axis = MV
What are the parts of a graph? Title = RV vs. MV Y-axis = RV X-axis = MV
TAILS ✔ list • Title – Does your title have the RV and MV in the correct order? • Axes – Do you have the manipulated and responding variables on the appropriate axes. • Intervals – Are the axes evenly spaced out and not crowded? • Labels – Are the axes labeled with units (cm, L, s, kg, etc.)? • Scale – Does your data fit your entire graph?
Quick Practice (Left Page) Copy this table down and create a line graph for it!
Graph Types Vs.
Graph Types Line Graph - Use when the MV changes amount (day #, amount of fertilizer, etc)
Graph Types Bar Graph - Use when the MV changes type (person name, color of flower, etc.)
Summary • Take 3 minutes to write a summary of today’s notes! • Additional Resources • https://www.youtube.com/watch?v=fvYsQ27qzxY • https://www.youtube.com/watch?v=2zDS_zpCS4A