Download
1 / 29
290 likes | 437 Views
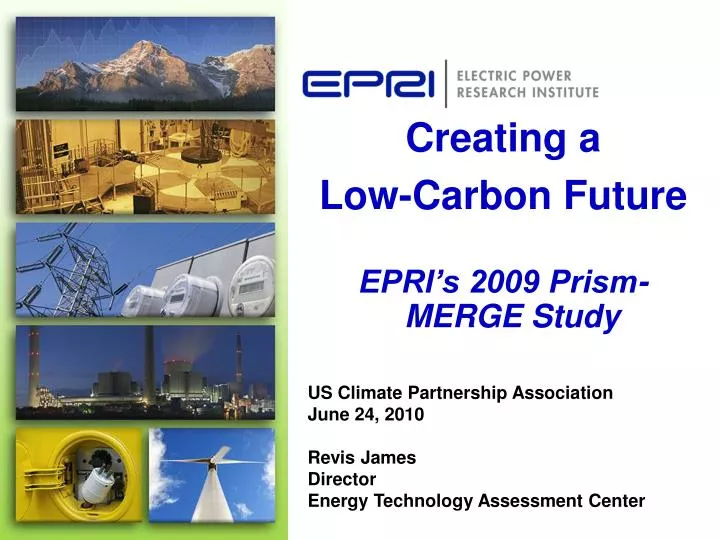
Creating a Low-Carbon Future EPRI’s 2009 Prism-MERGE Study. US Climate Partnership Association June 24, 2010 Revis James Director Energy Technology Assessment Center. Converging Policy Drivers. CO 2 policy Other potential issues Ash Environmental impact of renewables

E N D
Creating a Low-Carbon Future EPRI’s 2009 Prism-MERGE Study US Climate Partnership Association June 24, 2010 Revis James Director Energy Technology Assessment Center
Converging Policy Drivers • CO2 policy • Other potential issues • Ash • Environmental impact of renewables • Water availability for power plant cooling • Existing environmental policies (e.g. SOx, NOx) • Renewable Portfolio Standards (RPS)/ Renewable Energy Standards (RES)
Ever-Present Technical Drivers • Hedge technology risks • Recognize long lead times for technology deployment. • Meet demand • Maintain reliability • Minimize cost
Capability to Reduce CO2 EmissionsPrism Technology Analysis • Bottoms-up performance and cost analysis of key technology options to reduce electric sector CO2 emissions • Based on domain expert evaluation of feasible technology performance, deployment improvements • Performance and technology advancements • Presumes sustained, successful RD&D • Updated annually
3500 3000 Efficiency 2500 Renewables Nuclear 2000 Fossil Efficiency U.S. Electric Sector CO2 Emissions(million metric tons) CCS 1500 41% below 2005 PEV Electro-Technologies 58% below 2005 1000 500 0 1990 1995 2000 2005 2010 2015 2020 2025 2030 U.S. Electricity SectorImpact of 2009 Prism Assumptions EIA 2009 baseline
Assess Technology Development Strategiesvia Energy-Economic Analysis • Look at electricity sector in context of overall U.S. and global economy • Focus on economic output as the metric • Integrate effect of expected CO2 policy, technology costs and development for different future technology scenarios • Models competition between options to investment in the electric sector with other opportunities in the rest of the economy. • Provides a foundation to which additional assumptions/ models re: energy consumption behavior, public policy can be added.
MERGE Energy-Economic Analysis Model • Optimization Model of Economic Activity and Energy Use through 2050 • Maximize Economic Wealth • Inputs • Energy Supply Technologies and Costs for Electric Generation and Non-Electric Energy • Constraints • Greenhouse Gas Control Scenarios • Energy Resources • Outputs • Economy-wide Impact of Technology and Carbon Constraints
8 Assumed Economy-wide CO2 Reduction Target* 7 2005 = 5982 mmT CO2 6 2012 = 3% below 2005 (5803 mmT CO2) 2020 = 17% below 2005 (4965 mmT CO2) 5 2030 = 42% below 2005 (3470 mmT CO2) 4 3 2050 = 83% below 2005 (1017 mmT CO2) 2 83% Reduction in CO2 emissions from 2005 1 0 1990 2000 2010 2020 2030 2040 2050 Assumed CO2 Emissions Limits Historical Emissions Remainder of U.S. Economy Billion tons CO2 U.S. Electric Sector *no international offsets
Economic Deployment under Different Scenarios Limited Portfolio Full Portfolio Demand Reduction Demand Reduction Biomass Wind Solar Hydro Biomass Wind Nuclear Hydro Nuclear Gas Gas Coal New Coal + CCS Coal CCS Retrofit
Key Technology Portfolio Insights • Aggressive energy efficiency needed with either portfolio • 52% Increase in Demand Reduction with Limited Portfolio • Over 20% renewables generation share by 2030 with either portfolio • >50% renewables by 2050 with limited portfolio • If availability of new nuclear and CCS post 2020 uncertain, natural gas power production expands rapidly • Limited Portfolio – Gas Consumption Increases 275% from 2010 to 2050
Technology Transition followed by Transformation • Full Portfolio Scenario • 2010 – 2030 • Natural gas • Reduced demand via efficiency • Emergence of large-scale renewables • Retrofit/life-extension of existing plants • Beyond 2030 • Even more energy management and efficiency. • Large-scale generation from renewables. • Nuclear and advanced coal + CO2 capture/storage
$220 $200 $180 $160 $140 $120 $100 $80 $60 $40 $20 $0 Impact on Busbar Electricity Production Costs Limited Portfolio Limited Portfolio Full Portfolio 160% $/Mwh (2007$) Full Portfolio 50% BAU U.S. Average Wholesale Electricity Cost * 2007 U.S. Average Wholesale Electricity Cost 2007 U.S. Average Wholesale Electricity Cost * Based on estimate of expected business as usual annual investment in generation expansion. Source: “Transforming America’s Power Industry: The Investment Challenge 2010-2030”, The Edison Foundation, 2008 (www.edisonfoundation.net) and U.S. DOE Energy Information Administration 2008 Annual Energy Outlook. 2020 2030 2040 2050
Limited Portfolio $/metric ton CO2 (2007$) Full Portfolio U.S. CO2 Emissions Allowance Costs
Impact of CO2 Constraint on U.S. Economy Change in Discounted GDP from 2020 Through 2050 ($Trillions) Full Portfolio Limited Portfolio Cost of Policy Advanced technologies without CCS or new Nuclear Reduction in Policy Cost with Advanced Technology Value of R&D Investment
Cost Trajectories for Decarbonization 22 2050 MERGE Projections 2020-2050 2050 20 Limited Portfolio Limited Portfolio 18 16 2040 2040 14 2040 2030 2040 12 2030 2050 2050 2020 Busbar Electricity Cost (2007 cents/kWh) 2020 Full Portfolio 10 Cost of Electricity 2030 2030 2020 2020 Full Portfolio 2007 8 6 4 2 0 0.70 0.60 0.50 0.40 0.30 0.20 0.10 0.00 Emissions Intensity (metric tons CO2 /MWh) De-Carbonization
$220 $200 $180 Technology Actions Based on Meeting the Prism Technology Targets RD&D and Deployment Challenge $160 $140 $120 Technology Innovation to De-carbonize While Achieving a Cost of Electricity Near Today’s Level $100 Innovation Challenge $80 $60 $40 $20 $0 Meeting the Research Challenge Limited Portfolio Limited Portfolio Full Portfolio $/Mwh (2007$) Full Portfolio 2007 U.S. Average Wholesale Electricity Cost 2007 U.S. Average Wholesale Electricity Cost 2020 2030 2040 2050
Energy-Economic Analysis ResultsKey Technology R&D Insights • Smart Grid technologies will be very important, because improved end-use efficiency is likely to play a major role under future policies. • Energy storage, advanced grid management, and expanded transmission will be essential so that a large amount of electricity can be generation from variable output renewables. • Reducing cost of nuclear plant construction and operations, and economic penalty for CO2 capture and storage will be important, because the collective generation from coal and nuclear is likely to remain substantial.
Transition, then Transformation • Much of the technology needed to meet many of our concurrent demands and requirements is either not available or too expensive. • Some technologies will be critical to “bridging” the gap between today and a very different electricity technology mix in the future. • Disruption can come in different ways: • Substantially larger or smaller roles for certain technologies relative to the past • Unexpected technology barriers
Critical Conclusions • With achievement of aggressive but technically feasible levels of technology performance and deployment, U.S. electric sector has potential to reduceCO2 emissions by 41% by 2030. • An optimal technical and economic strategy is comprised of aggressive end-use efficiency and a diverse generation technology portfolio. • Ensures technological resiliency. • Lowers overall economic cost of emissions reductions by ~37%. • All technologies are not yet ready - focused, sustained research, development and demonstration over the next 20 years is necessary. • Decarbonized electricity will be critical in reducing costs of reducing CO2 emissions from transportation and other economic sectors.
For More Information EPRI Report #1020389 www.epri.com
Wildcards • High conversion efficiency, low cost, solar photovoltaic cells. • Low-cost, high capacity, short-discharge time energy storage. • Lower-cost modular nuclear reactors.
Comparison of Current to Future U.S. Electricity Generation Based on 2009 Prism Renewables Coal Nuclear Coal Coal + CCS Nuclear Gas Gas “FUTURE” “TODAY”
EE/Demand Reduction Biomass Coal / Gas + CCS Full Portfolio Scenario in 2050 – Transformation
U.S. Natural Gas Consumption based on 2009 MERGE Analysis Limited Portfolio Full Portfolio
Electrification under an 80% below policy Full Portfolio Limited Portfolio Electricity share of final energy demand (indexed to 2000)