Download
1 / 68
680 likes | 908 Views
Water Quality Monitoring : Galla Creek Bayou Bartholomew L’Anguille River. Presented By: The Ecological Conservation Organization. Galla Creek. Galla Creek originates northwest of Atkins, AR. Drains approximately 46 square miles.

E N D
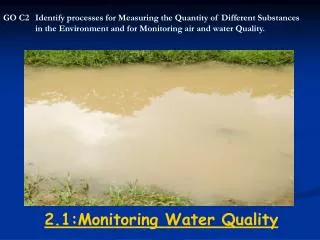
Water Quality Monitoring :Galla CreekBayou Bartholomew L’Anguille River Presented By: The Ecological Conservation Organization
Galla Creek Galla Creek originates northwest of Atkins, AR. Drains approximately 46 square miles. Galla Creek Watershed is a sub-watershed of the Lake Conway Point Remove Watershed. Galla Creek Lake and Galla Creek WMA
Galla Creek Goals • To develop an EPA approved functional tool to ensure the successful implementation of effective and efficient monitoring. (i.e. Quality Assurance Project Plan) • To continue water quality monitoring at two water quality monitoring stations in order to determine parameter trends during the project period . • Prepare report with water quality results.
Galla CreekObjectives • Use representative monitoring stations with similar physical attributes while maintaining precise and accurate sampling protocols. • Collect grab samples routinely at weekly intervals. • Determine concentrations of extracted samples. • better understand the fluctuating pollutant trends and dynamics within the water system
Methodology • Grab sample Collection every week • In situ Sondes to record pH, DO, temperature, and Specific Conductance • Data analysis and statistical evaluation
DO pH Galla Creek In-situ Results DO pH DO DO pH DO pH pH
Temperature Specific Conductance Galla Creek In-situ Results Temperature Temperature Specific Conductance Specific Conductance
ResultsReg. 2 Turbidity Standard Base Flow (NTU <21) • G1 – 96% of samples met standard • G2 – 75% of samples met standard Storm Flow (NTU <40) • G1 – 98% of samples met standard • G2 – 94% of samples met standard
L'Anguille River Bayou Bartholomew
Goals • To develop an EPA approved functional tool to ensure the successful implementation of effective and efficient monitoring. (i.e. Quality Assurance Project Plan) • To determine trends in parameter concentrations during the project period at each monitoring station. • To determine accurate estimations of parameterloadings. • Provide statistical analysis to better understand the dynamics of pollutants in the watershed • Compare the estimated parameter loadings to the established TMDL. • Prepare report with water quality results.
Objectives • To collect sufficient amount of water qualitysamples and data to determinetrends in parameter concentrations and to estimate parameter loadings at each monitoring station. • To validate sampling results thoroughly against quality assurance and quality control (QAQC) measures
Collected Data • Routine samples – collected every 23 hours,later compositedinto one weekly composite sample • Grab samples – collected once per week • Replicate Samples – 10% of Grab and Composite Samples • Blank Samples – Every site, every sample set • YSI 600-OMS Optical Sonde – turbidity, specific conductance, and water temperature • YSI 556 Handheld Sonde – water temperature, specific conductance, pH, and dissolved oxygen • River Stage • USGS, COE and ECO
Laboratory Analyses Parameter List • Nitrate + Nitrite-Nitrogen • Ammonia-Nitrogen • Total Kjeldahl Nitrogen • Total Phosphorus • Total Suspended Solids • Turbidity
QAQC Samples Field Blank – Analyte free deionized water transported into the field in a clean container, where it was transferred into a sample container at the site of sampling. From that point, it was treated the same as other samples. Replicate Sample – During a field operation, two samples were obtained simultaneously from the water body being sampled. One sample was designated by the appropriate sample number while the other used the same number followed by “REP”. Split Sample – Two aliquots from one sample bottle were analyzed for each set of samples. This sample was designated with “Split” following the sample number. Spiked Sample – An addition of a standard to one sample per set of samples was made which increases the concentration of the analyte by a set amount. Split Spike Sample – For some parameters, it is advantageous to use the spike sample for the sample which is to be split. For such parameters, two spiked samples were prepared; one was indicated with an “S” and the other with an “SS” indicating a split spike.
Loading Requirements Load - the mass of pollutant that passes a sampling station over a specific period of time (Hedlin et al, 2006) Due to the dynamic nature of rivers, accurate estimation of parameter loads should be conducted with high frequency sampling and continual discharge measurements. Two Essentials – Sample Concentration and Discharge Data Often the number samples that are collected and analyzed is dictated by budgets. Collecting continuous discharge data is much easier and more affordable then collecting continuous parameter concentration data
Loading Methodology Period–weighted method • Apply mass integration to datasets that have continuous discharge but do not have continuous concentration data. • Assumptions must be made about unknown concentrations in between collected water samples and measured concentrations. • Measured concentrations are assumed to represent a period around which the sample was collected. • The product of concentration and discharge is summed through time to determine load.
Introduction Bayou Bartholomew Begins northwest of Pine Bluff, AR and flows approximately 359 miles to confluence with Ouachita River (Hydrologic Unit 08040205) Impaired and on the federal 303(d) list Two sampling stations, previously established Said to be Longest Bayou in the World
Bayou Bartholomew Mean Sample Concentrations
BB 1 Garrett Bridge, Arkansas Located near Dumas, AR off Hwy 54; Lincoln County, Arkansas Latitude 33°51'59", Longitude 91°39'22" NAD27 Hydrologic Unit 08040205-013
BB 2 Portland, Arkansas Approximately sixty miles downstream from BB-1 Located off Hwy 278; Ashley County, Arkansas Latitude 33°13'50", Longitude 91°32'08" NAD83 Hydrologic Unit 08040205-002
NA Monthly Loading at BB2 NA
ResultsBayou Bartholomew Exceeding TMDL for TSS BB1 – 82% of time 3,496 lbs/day (July-Nov) 14,478 lbs/day (Dec-June). BB2 – 91% of time 30,629 lbs/day (July-Nov) 66,836 lbs/day (Dec-June).
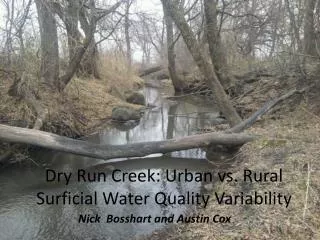
Introduction L’Anguille River L'Anguille River at its mouth is 938 square miles (HUC 08020205) Begins south of Jonesboro, AR and confluences with St. Francis south of Crowley’s Ridge eco-region Impaired on the federal 303(d) list for not supporting aquatic life due to siltation Two previously established monitoring stations Mostly agricultural land
L2 Highway 364 near Vanndale, Arkansas Reach Five of the L’Anguille River Latitude 35°19'32.00"N Longitude 90°51'41.09"W