Download
1 / 25
250 likes | 369 Views
Water Quality Monitoring and Parameter Load Estimations in Lake Conway Point Remove Watershed and L’Anguille River Watershed. Presented by: Dan DeVun, Equilibrium devun@equilibrium-ar.org www.equilibrium-ar.org 09/19/2013. Projects Primary Goal.

E N D
Water Quality Monitoring and Parameter Load Estimations in Lake Conway Point Remove Watershed andL’Anguille River Watershed Presented by: Dan DeVun, Equilibrium devun@equilibrium-ar.org www.equilibrium-ar.org 09/19/2013
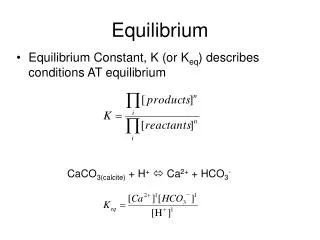
Projects Primary Goal By collecting, analyzing and reporting water quality and discharge data; provide monthly and annual parameter loadings, as well as unit area loadings in numerous 12 digit HUCs.
Monitoring Structure – Similar activities are implemented in each monitored watershed that support each project’s primary goal. • Water Quality Requirements – Incorporates project design, collection methodology and analytical methodology to generate representative data and allow for an evaluation of water chemistry within the selected watersheds. • Discharge Requirements – Estimate the volume of water that passes the monitoring station during the sampling period. • Data Compilation and Statistical Analysis – Compile and statistically analyze the collected data to provide monthly, annual, and unit area loadings, as well as, compare results between monitoring stations. • Reporting Requirements – Provide the project participants with the project outcomes and make the results readily available to the natural resource and watershed professionals and the general public.
Equilibrium’s Monitoring RequirementsWater Quality • Sample Types – Discrete grab samples, when possible we collect depth integrated samples at the mid point of the stream • Collection Frequency – Once per week (Typically LCPR is collected on Monday and L’Anguille is Thursday) • In-situ Parameters – Temperature, dissolved oxygen, specific conductance, pH, and stage. • Record Field Notes – documentation that includes type of sample, time and date, site location, name of sampler, climatic characteristics during site visit, recognized problems, and corrective actions required or taken.
Equilibrium’s Monitoring RequirementsWater Quality (Continued) • Laboratory Parameters – TSS, Turbidity, Total Phosphorus, Total Kjeldahl Nitrogen, Nitrate-Nitrogen, Ammonia-Nitrogen, Total Nitrogen, Chloride and Sulfate. • QAQC Samples – Samples taken to insure representativeness of collected data. (include replicate, field blanks, split and spiked samples) • Ouachita Water Laboratory – a state certified laboratory, which was established in 1969.
Equilibrium’s Monitoring RequirementsDischarge • Monitoring Station Location – When possible, locate monitoring stations where existing USGS stations are located. • Discharge Parameters – Stage, Profile, and Velocity • Stage – Utilize pressure transducers to continuously measure stage. Additionally, manually measure stage at the time of water quality collection. • Profile – survey and record the stream’s cross sectional profile • Velocity – utilize numerous instruments (electromagnetic and acoustic doppler methodologies) to calculate stream velocities
Equilibrium’s Monitoring RequirementsDischarge (Continued) • Discharge Measurements –Stream discharge is measured at numerous points throughout the hydrograph. We attempt to measure discharge at a minimal of three different stages of each categorical flow. Low Flow, Mid Flow, High Flow • Develop the Stage Rating Discharge Curve– determine the mathematical relationship between stage and discharge for the measured discharge points. • Utilize the Stage Rating Discharge Curve – estimate daily discharge from the continuously collected stage data.
Data Compilation and Statistical Analysis • Compilation of collected data • Laboratory Water Quality Data • In-situ Water Quality Data • Historical Water Quality Data • QAQC Water Quality Data • Stage Data • Discharge Data • Historical Discharge Data • Precipitation Data • Statistical Analysis • Statistical relationship between stage and discharge • Calculation of parameter loadings • Statistical comparison between monitoring stations.
Reporting • Provide all project participants with a final report. • Provide public access of our data through WQX. • Our collected data and analysis can be beneficial to numerous persons working in fields related to water quality and water quantity.
Lake Conway Point Remove Watershed Ten monitoring stations Project Period is July 2011 – October 2014 Monitoring the “outfalls” of 12 digit HUC Currently in data collection phase. LCPR scored 91 in the Final Risk Assessment Matrix Percentile of the Arkansas’ Nonpoint Source Pollution Watershed Risk Matrix and has been selected as a priority watershed. NRCS identified LCPR as a priority in the Mississippi River Basin Healthy Watershed Initiative.
L’Anguille River Watershed Five monitoring stations Previous Project Period July 2011 – June 2012 Current Project Period July 2012 – September 2015 Monitoring the “outfalls” of 12 digit HUC • The L'Anguille River was included on the Arkansas 1998 303(d) list for not supporting aquatic • life due to siltation/turbidity and has been on each subsequent 303(d) list. • ANRC has designated the watershed as a priority watershed. • NRCS also identified the L'Anguille River as a priority in the • Mississippi River Basin Healthy Watershed Initiative.
Swat Model Percentile Contribution 40-60% 0-20% 80-100% 0-20% 20-40% Sediment Contribution
Swat Model Percentile Contribution 0-20% 40-60% 60-80% 0-20% 60-80% Total Phosphorus Contribution
Project Difficulties • Variable Climatic Patterns • Stream Activities • Unnatural Discharges • Equipment loss • Discharge Measurements
Questions? ? Thank You www.equilibrium-ar.org