Download
1 / 23
230 likes | 263 Views
Understand break-even analysis, determine optimal pricing, and strategize cost management for profitable business operations. Calculate break-even points, fixed vs variable costs, and revenue projections to steer your business towards success.

E N D
Key Questions • How many items should I order? • What should we charge per item? • How many items do we need to sell to make money?
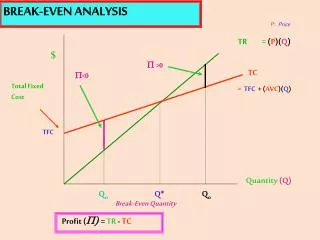
When will Your Business Make Money? Break-even point: no loss, no gain You need to know: How many units/hours do you need to sell in order to cover your costs? How much revenue do you need to bring in to cover your costs?
Break-even: Two Perspectives Break-even Volume = Number of Units (or Hours) to Achieve No Profit, No Loss Break-even Sales = Level of Revenue Needed to Achieve No Profit, No Loss
Fixed vs Variable Costs Gross Revenue % Profit (how much?) Fixed Cost % 100% = % Variable Cost
Wholesale vs Retail Price Retail Price Retail Markup 60% 100% = Wholesale Price 40%
Data Needed Total Fixed Costs Price per Unit Variable Cost per Unit Projected Unit Sales Projected Sales Revenue
Calculating Break-even Volume Break-even Volume = Total Fixed Costs Sales Price per Unit – Variable Cost per Unit
Data Needed Total Fixed Costs = $175,000 Sales Price per Unit = $10 Variable Cost per Unit = $4 Projected Unit Sales = 50,000 Projected Sales Revenue = $500,000
Step #1 – Revenue Line Total Revenue Revenue Line 45 degree angle
Step #1 – Revenue Line Total Revenue $1,000K $900K $800K $700K $600K $500K $400K $300K $200K $100K 0 Revenue Line 0 10K 20K 30K 40K 50,000 60K 70K 80K 90K 100,000 Unit Sales Volume
Step #2 – Fixed Costs Total Revenue $1,000K $900K $800K $700K $600K $500K $400K $300K $200K $100K 0 Revenue Line Fixed Costs = $175,000 0 10K 20K 30K 40K 50,000 60K 70K 80K 90K 100,000 Unit Sales Volume
Step #3 – Variable Costs Total Revenue $1,000K $900K $800K $700K $600K $500K $400K $300K $200K $100K 0 Revenue Line Total Costs = $375,000 Variable Costs = $200,000 Fixed Costs = $175,000 0 10K 20K 30K 40K 50,000 60K 70K 80K 90K 100,000 Unit Sales Volume
Step #3 – Variable Cost Line Total Revenue $1,000K $900K $800K $700K $600K $500K $400K $300K $200K $100K 0 Revenue Line Total Expense Line Total Costs = $375,000 Variable Costs = $200,000 Fixed Costs = $175,000 0 10K 20K 30K 40K 50,000 60K 70K 80K 90K 100,000 Unit Sales Volume
Step #4 – Break-even Point Total Revenue $1,000K $900K $800K $700K $600K $500K $400K $300K $200K $100K 0 Revenue Line Total Expense Line Total Costs = $375,000 Variable Costs = $200,000 B.E. = 29,167 units Fixed Costs = $175,000 0 10K 20K 30K 40K 50,000 60K 70K 80K 90K 100,000 Unit Sales Volume
Step #4 – Break-even Point Total Revenue $1,000K $900K $800K $700K $600K $500K $400K $300K $200K $100K 0 Total Revenue = $500,000 Profit = $125,000 Total Costs = $375,000 Variable Costs = $200,000 B.E. = 29,167 units Fixed Costs = $175,000 0 10K 20K 30K 40K 50,000 60K 70K 80K 90K 100,000 Unit Sales Volume
Your Break-even Estimate Each Executive: $8,000/month Each Tech/Sales: $7,000/month Each Admin: $5,000/month Headquarters: $1.50/sq. ft. Utilities/Operations: $1,000/month Your Product: $???/unit Parts/Materials: $??? Labor: $20/hr US or $0.50/hr China Shipping: $0.10/pound FOB China
Scenario #1 – Lower Fixed Costs Total Revenue $1,000K $900K $800K $700K $600K $500K $400K $300K $200K $100K 0 Lower Fixed Costs by 10% Total Revenue = $500,000 Profit = $142,500 Total Costs = $357,500 Variable Costs = $200,000 B.E. = 26,250 units Fixed Costs = $157,500 0 10K 20K 30K 40K 50,000 60K 70K 80K 90K 100,000 Unit Sales Volume
Scenario #2 – Raise Unit Price Total Revenue $1,000K $900K $800K $700K $600K $500K $400K $300K $200K $100K 0 Raise Price by 10% Total Revenue = $550,000 Profit = $175,000 Total Costs = $375,000 Variable Costs = $200,000 B.E. = 25,000 units Fixed Costs = $175,000 0 10K 20K 30K 40K 50,000 60K 70K 80K 90K 100,000 Unit Sales Volume
Scenario #3 – Lower Variable Costs Total Revenue $1,000K $900K $800K $700K $600K $500K $400K $300K $200K $100K 0 Lower Variable Costs by 10% Total Revenue = $500,000 Profit = $145,000 Total Costs = $355,000 Variable Costs = $180,000 B.E. = 27,344 units Fixed Costs = $175,000 0 10K 20K 30K 40K 50,000 60K 70K 80K 90K 100,000 Unit Sales Volume
Scenario Comparison Original Costs & Pricing … BE = 29,167 Profit: $125,000 Lower Fixed Costs by 10% … BE = 26,250 Profit: $142,500 Raise Unit Price by 10% … BE = 25,000 Profit: $175,000 Lower Variable Unit Cost by 10% … BE = 27,344 Profit: $145,000