Download
1 / 10
100 likes | 371 Views
Creating maps with Local Studies. Y5 Methodist J & I, Wakefield Thursday, 22 November 2007 Wendy North Primary Project Leader, Action Plan for Geography GA. Red Riding Hood’s Walk.

E N D
Creating maps with Local Studies Y5 Methodist J & I, Wakefield Thursday, 22 November 2007 Wendy North Primary Project Leader, Action Plan for Geography GA
Red Riding Hood’s Walk We learnt how to use the programme by mapping a story. The story chosen was Little Red Riding Hood. We thought that this would be a good story to share with younger children. This example of Red Riding Hood’s walk map was created by Wendy
In the second week we explored the locality of the school using Quikmaps http://www.quikmaps.com/full/46681
Maps that show how we feel • I used this aerial view of the children’s local area to introduce the idea that maps can show a variety of things including information about how we feel in particular places. I feel pleased if I can find my way into school through the estate I really enjoy the views of Wakefield that I can see from the hill in Thornes Park
Gradually we zoomed in to look closely at the school and grounds • We talked about how things have changed since this photograph was taken. We added extra detail onto the image using the Interactive Whiteboard. This view of the school was obtained from Loc8 a website developed by the Yorkshire & Humberside Grid for Learning
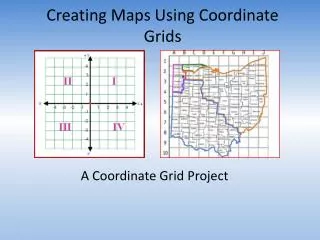
Creating maps using Local Studies • We imported an outline map as a background. This gave us the framework onto which we could draw our own detail.
In Week Four we added hotspots to the maps to show how we felt about our school and grounds.
Find out more about using Local Studies and Quikmaps http://www.primarygeogblog.blogspot.com/
Find out more about Local Studies • at: http://www.soft-teach.co.uk/