Download
1 / 19
190 likes | 288 Views
Seating – 3 rd period. Sit in the front 8 seats. Colby Merlonda Jaylon Doyle Joao Quinton Adam Tori. Warm-up December 4, 2013. Minutes 1 2 3 4 5 Kilometers 50 100 150 200 250

E N D
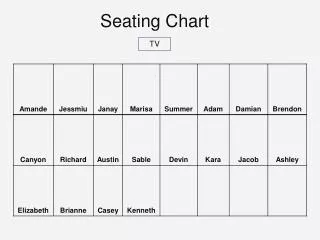
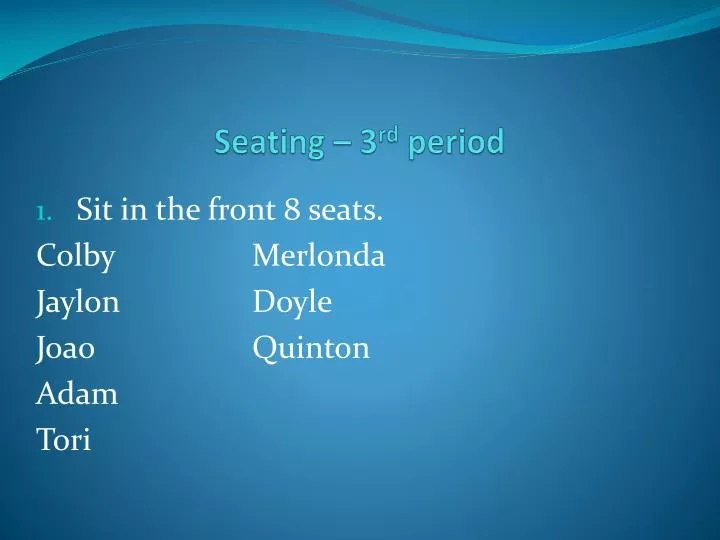
Seating – 3rd period Sit in the front 8 seats. Colby Merlonda Jaylon Doyle Joao Quinton Adam Tori
Warm-upDecember 4, 2013 Minutes 1 2 3 4 5 Kilometers 50 100 150 200 250 Does this represent a proportional relationship. If it is, what is the constant of proportionality (rate of change) for this relationship? 2. Write an equation that represents the table.
Class work • Chapter 5, lesson 5 – Graphing Proportional Relationships • Pages 390 – 392, problems 5, 7, 8, 10, 13, 14, 15, 16, 17, 18, and 19 • Before you whine – these are easy!!!!
Seating – 4th period Sit in the front 8 seats. Jeef Kenton KeyannaAnahi GuilhermeRishauna Concepcion Samiya
Warm-upDecember 4, 2013 Minutes 1 2 3 4 5 Kilometers 50 100 150 200 250 Does this represent a proportional relationship. If it is, what is the constant of proportionality (rate of change) for this relationship? 2. Write an equation that represents the table.
Class work • Chapter 5, lesson 5 – Graphing Proportional Relationships • Pages 390 – 392, problems 5, 7, 8, 10, 13, 14, 15, 16, 17, 18, and 19 • Before you whine – these are easy!!!!
Seating – 5th period Sit in the front 8 seats. Jyde Solomon Tarheem Haley Devin Matthew Carley Marcus
Warm-upDecember 4, 2013 Textbook page 377 Problems 1 and 2
Class work • Chapter 5, lesson 4 – Proportional and Nonproportional Relationships • Page 377, problems 3 and 4 • Page 379, problems 10 - 13
Seating – 6th period Sit in the front 8 seats. Esther Deja Wesley Shania Brianna Gregory Janinna Gabrielle
Warm-upDecember 4, 2013 Minutes 1 2 3 4 5 Kilometers 50 100 150 200 250 Does this represent a proportional relationship. If it is, what is the constant of proportionality (rate of change) for this relationship? 2. Write an equation that represents the table.
Class work • Chapter 5, lesson 5 – Graphing Proportional Relationships • Pages 390 – 392, problems 5, 7, 8, 10, 13, 14, 15, 16, 17, 18, and 19 • Before you whine – these are easy!!!!
Seating – 7th period Sit in the front 8 seats. William Destiny HallieAryanna Jacob Amari Ayanna Tre’Von
Warm-upDecember 4, 2013 Minutes 1 2 3 4 5 Kilometers 50 100 150 200 250 Does this represent a proportional relationship. If it is, what is the constant of proportionality (rate of change) for this relationship? 2. Write an equation that represents the table.
Class work • Chapter 5, lesson 5 – Graphing Proportional Relationships • Pages 390 – 392, problems 5, 7, 8, 10, 13, 14, 15, 16, 17, 18, and 19 • Before you whine – these are easy!!!!
Scale Factor • Scale Factor = Image / Original 6 13 18 v W
SIMPLE AND COMPOUND INTEREST • SIMPLE: $ * I * # of years • Dollar amount times the interest rate (as a decimal) times the number of years • COMPOUND: $ * I for year one, then new $ amount times I for year 2, then new $ amount times I for year 3, etc.
Find the simple interest to the nearest cent. • $720 at 8% for 5 years • $385 at 6% for 3 years • $1200 at 4% for 18 months • $1950 at 7% for 6 months • $4250 at 9.25% for 10 years
Find the total amount in each account to the nearest cent (interest compounded annually). • $2200 at 5% for 2 years • $3850 at 6% for 3 years • $4075 at 4% for 3 years • $325 at 7% for 6 years • $1000 at 4% for 5 years