Download
1 / 12
120 likes | 182 Views
Learn how to update Excel templates for NTC Analytics using the latest data from Google Analytics. Follow these step-by-step instructions to download the data, update your spreadsheet, and transfer the new chart to PowerPoint for a professional report.

E N D
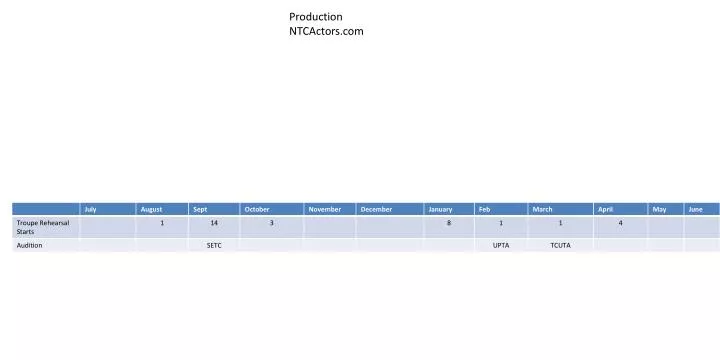
Production NTCActors.com
These examples use School Marketing, but apply for all sections of NTCAnalytics.com Go to NTCAnalytics.com and Download these templates
Go to NTCAnalytics.com and Click this link (“Google Analytics Visitors Report”)
In the page that opens, click “Export” and chose “CSV”. If prompted by your browser, click Save. This downloads the latest data from Google Analytics, which you’ll use to update your spreadsheet.
…and your chart is updated!… …and paste it into the Excel template you opened earlier… Then select all of the data and copy….
Click on your chart to select it. Press CTRL+C to copy
In the first slide of this PowerPoint, click on the chart and delete it.
Position and resize chart so that the dates approximately match the grid below. Save this PowerPoint .