Download
1 / 59
610 likes | 635 Views
Learn about the INCA system background, infrastructure, and products. Discover how the numerical weather prediction model improves short-range forecasts through high resolution and bias correction. Dive into INCA's modules, including NWP processing and interpolation techniques. Understand the added value of INCA in meteorological analysis and forecasting. Join the informative lectures scheduled in Israel this November to enhance your understanding of this innovative system.

E N D
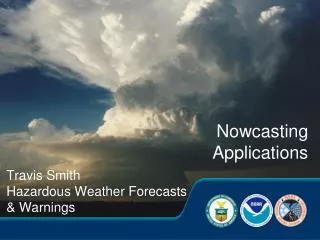
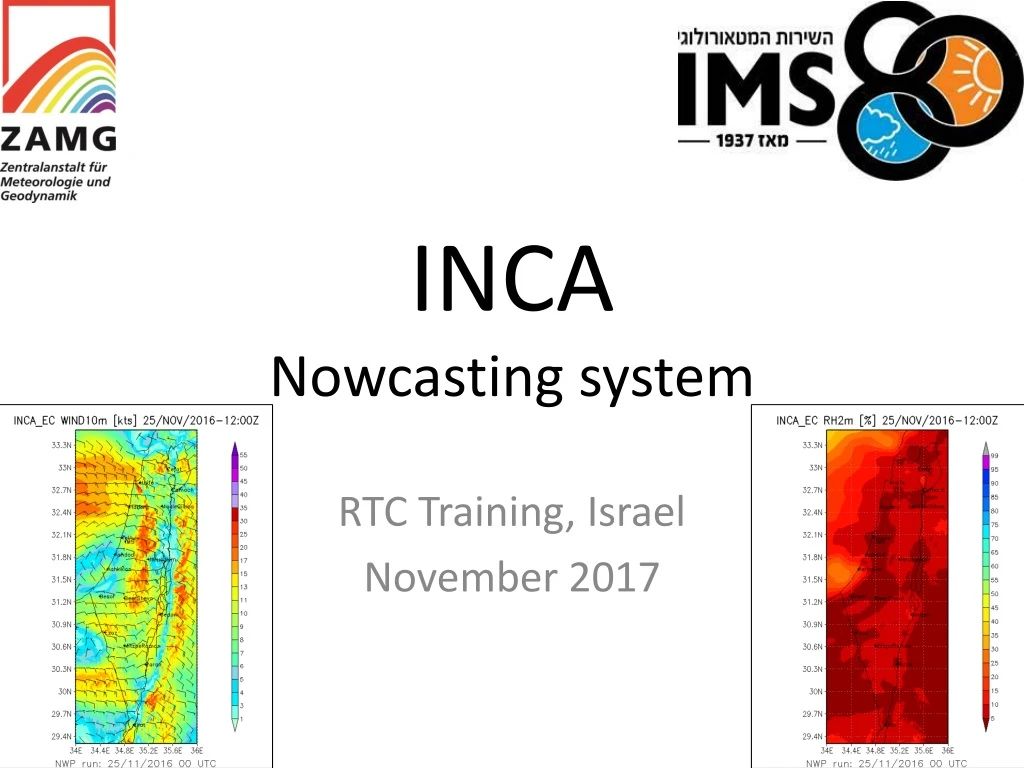
INCANowcasting system RTC Training, Israel November 2017
The lecture topics: • System background • Infrastructure & I/O • Products
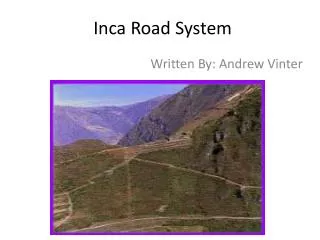
System background • INCA – Integrated Nowcasting through Comprehensive Analysis. • Developed by ZAMG: http://www.zamg.ac.at/fix/INCA_system.pdf • IMS joined INCA-CE project in 2011. • Operational mode since 2013
System background System input Automatic Weather Station Observation measurements INCA System output Numerical Weather Prediction Model forecast Nowcast – short range forecast Weather RADAR Meteorological Satellite
System background • The added value of the system: • High resolution and Bias correction. • Nowcasting. • Improvement of the short range forecast (first 6 hours) and in farther forecasting range.
System background A look “Inside” INCA Forecasted field Temperature & Humidity module Forecasted field NWP NWP processing module Input Wind module Stations/RADAR/Satellite Forecasted field n’th module
System background • NWP processing module • Reads the NWP model fields and Interpolates them to INCA levels and grid: • Spatial resolution: 1km/100m (Lambert Conic Conformal projection). • Vertical resolution: 200m to all fields, except for wind 125m. • Forecast time resolution: 10 minutes/Hourly basis. • Processing includes 2D and 3D interpolation. • The fields on INCA grid are being used by the system’s module to create the Nowcast.
System background Bilinear interpolation (wikipedia): considers the closest 2x2 neighborhood of known pixel values surrounding the unknown pixel's computed location. It then takes a weighted average of these 4 pixels to arrive at its final, interpolated value. The weight on each of the 4 pixel values is based on the computed pixel's distance (in 2D space) from each of the known points. http://en.wikipedia.org/wiki/Bilinear_interpolation
System background Trilinear interpolation (wikipedia): is the extension of linear interpolation, which operates in spaces with dimension D = 1, and bilinear interpolation, which operates with dimension D = 2, to dimension D = 3. http://en.wikipedia.org/wiki/Trilinear_interpolation First we interpolate along z (imagine we are pushing the front face of the cube to the back), giving: Then we interpolate these values (along y, as we were pushing the top edge to the bottom), giving: Finally we interpolate these values along x (walking through a line):
System background • The different modules take into account: • physical effect of the topography. • change of temperature gradient at the boundary layer.
System background • The different modules take into account - continue: • the heating/cooling of the surface during the day/night. • the differences between the NWP to the Observations. • Mass conservation during the wind flow. • The effect of AWS one on the other. • The effect of orography on precipitation… etc.
System background The Analysis & Forecast maps are in 1km/100m resolution. The forecast range is defined by the user First 6-12 hours are combination of system and NWP The rest of the forecast range – donation of the NWP downscaled to INCA’s grid and topography
System background Averaged on 88 AWS for the month of june INCA Analysis INCA forecast NWP
Infrastructure & I/O • Linux based system. • Serial computing (in export version). • Bash shell scripts wrapping c and Fortran code. • At IMS graphics output is with Python and GRADS.
Infrastructure & I/O • Numerical Prediction Model Input: • GRIB 1 format • Hourly basis • At IMS: ECMWF/COSMO • 2D & 3D fields: temperature, precipitation, etc. • Convention: ECMWF+000.grb….ECMWF+012.grb
Infrastructure & I/O • Automatic Weather Station Input: • Hourly/10 minutes • At IMS, database mining using ad-hoc pearl script. • Text file including gathered measurements from stations observation. • Meta data file regarding stations: geographic location, altitude, etc.
Infrastructure & I/O • RADAR data input: • Raw data • Post processed: clutter filtering, CAPPI 1km product. • 5 minutes basis.
Infrastructure & I/O • System output: • ASCII files • BIL (Binary Interpolated ) files – simple binary file without header. • Images • Post-procced data: Meteograms, PDF
Infrastructure & I/O INCA wind module example
Infrastructure & I/O The stages of calculating wind at 10m: Reading INCA topography and land use (Surface type). Calculating f10 factor. Reading stations metadata. Getting precipitation data for effect on wind calculation – optional. Defining system levels. Calculating shaved elements. Reading data stations observations. Reading data from Radio-Sonda - optional. Reading the NWP wind fields in INCA levels and grid.
Infrastructure & I/O The stages of calculating wind at 10m - continue: Finding wind differences between the NWP and stations. Finding wind differences between the NWP and Radio-Sonda - optional. Creating NWP/OBS interpolated differences map. Creating Precipitation wind effect interpolated map – optional. Adding relaxation procedure – mass conservation Creating wind at 10m adding “lake” effect. Writing modules output fields as ASCII and BIL files.
Infrastructure & I/O f10 factor calculation – depends on differences between the INCA and the NWP topography
Infrastructure & I/O IDW Interpolation of the NWP and station wind differences Example is taken from the temperature IDW. Same is done for the wind. Constants for wind are n=4 and c=20. (INCA_system.pdf).
Infrastructure & I/O Shave elements method is used for Mass conservation calculation (INCA_system.pdf). (2011_Haiden_et_al.pdf)
Infrastructure & I/O from DWD slide show about z coordinate system and shaved elements
Infrastructure & I/O Mass Conservation (מתוך INCA_system.pdf).
Infrastructure & I/O Adding the “lake” effect
Infrastructure & I/O Forecast is created by using weights between INCA Analysis and NWP
products • INCA system customers: • Israel Meteorological Service: • Forecasting department/operation center - INCA maps, Forecast to Airfields, NWP/OBS auto-check. • Research & Development department - evapotranspiration , radiation calculations. • Climate department • Chemical Hazard spill application • Israel Hydrology Service/Water Authority • INCA precipitation analysis coupled with Hydrological model. • Israel fire fighters/Police/Road Safety Agency • TV channels • The public
products Snow case 19-20/02/2015
products Grus in Snowing “Hola” valley http://www.nrg.co.il/online/1/ART2/678/158.html
products Nowcast for Airfields
products Severe storm case 7/5/2014
products From INCA_system.pdf