Download
1 / 28
280 likes | 406 Views
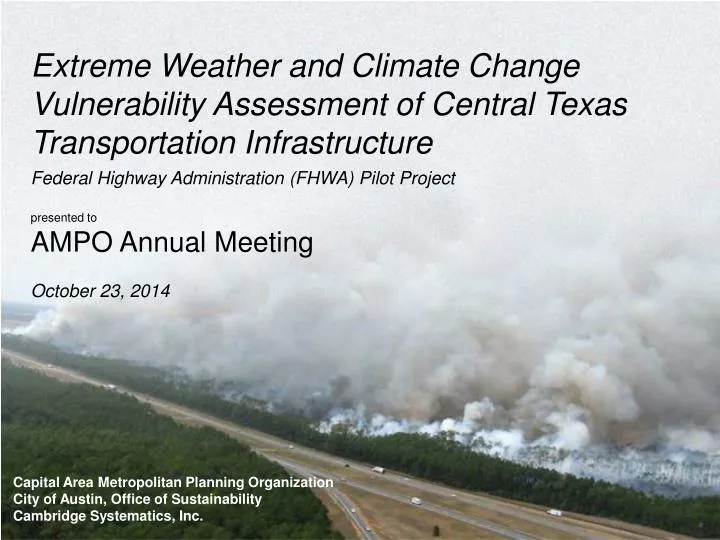
Extreme Weather and Climate Change Vulnerability Assessment of Central Texas Transportation Infrastructure Federal Highway Administration (FHWA) Pilot Project p resented to AMPO Annual Meeting October 23, 2014. Capital Area Metropolitan Planning Organization

E N D
Extreme Weather and Climate Change Vulnerability Assessment of Central Texas Transportation Infrastructure Federal Highway Administration (FHWA) Pilot Project presented to AMPO Annual Meeting October 23, 2014 Capital Area Metropolitan Planning Organization City of Austin, Office of Sustainability Cambridge Systematics, Inc.
Project overview Cathy Stephens, CAMPO
The CAMPO Region • Project Area • Population (April 1st, 2013) • City of Austin: 842,750 • Regional: 1,870,872 • Regional 2040: 4,100,000
Local Flavor • Live Music Capitol • SXSW • ACL LIVE • ACL music fest • Circuit of the Americas • UT Austin • Food trucks • State Politics • High Tech
Regional Transportation System • Six counties covering 5,300 square miles • 12,420 lane miles • 1 Commuter rail line • Local, express, BRT service • 41.8 million vehicle miles traveled daily • 31.2 million transit boardings each year
Physical Characteristics • Topography and geology • West – rocky hill country • East – flatter, softer soils Source: Geologic Atlas of Texas, Texas Water Development Board Source: CAMPO, FEMA
Soil Plasticity Clay soils on the east side have high soil plasticity Causes pavement, road bed and utility problems when soil expands and shrinks with varying soil moisture
Extreme Weather in Central Texas • Key weather stressors • Flooding – vulnerable to flash floods, tropical storms • Drought – ongoing drought • Extreme Heat – 2011 90 days over 100 degrees • Wildfire – 2011 wildfires • Extreme Cold – 5 ice days last winter • Region’s rapid growth contributes to impacts
Impacts of Extreme Weather Buckling roads - 2009 Sinkhole - 2009 Aftermath of wildfire - 2011 Drought: Disrupted Water - 2011 High winds - 2013 Wildfires - 2011 Flooding: Tropical Storm Hermine - 2010 Fallen tree - 2013
Pilot Project Overview • Assess the transportation system’s vulnerability to the impacts of extreme weather, now and future • Roads, rail, transit • Incorporate results into the 2040 planning process to increase extreme weather resilience • Nature of results will determine how they are incorporated • Share results with partners, stakeholders and public • City of Austin, TxDOT, Capital Metro, FHWA • Started project in early 2013, will wrap up in 2014
Approach & Results Josh DeFlorio, Cambridge Systematics
Inventory & Criticality • Transportation data collection and integration • Screening in GIS using criticality indicators • Workshop with agencies to select critical, potentially vulnerable assets • Selected 9 assets for screening
Sensitivity • Sensitivity focus groups with infrastructure managers • Identified stressors of concern • Flooding, drought, extreme temperatures, wildfire, “extreme” cold • Developed suggested risk indicators and thresholds
Illustrative Sensitivity Indicators Sensitivity Indicators Adaptive Capacity Indicators 24-hour precipitation design threshold Criticality Average inundation velocity Evacuation route? Scour criticality AADT Flooding Wildfire Threat Truck traffic volume Soil plasticity Detour length Pavement binder Functional class Drought Truck traffic volume Heat Wildfire sensitivity Whether roadway is elevated Wildfire Cold/Ice
Climate Data • Dr. Kerry Cook, UT-Austin • Used RCM (instead of BCSD) • Advantages: Physics-based, broader range of variables (soil moisture) • Disadvantages: Inability to vary emissions/GCMs to develop scenarios (varied geography instead) • Three “scenarios”—geographic, rather than emissions-based • Outputs served as inputs to Vieux model, other assessment platforms
ExampleNumber of Dry Days Per Year Scenario 1: 4 per year (4 additional dry days); 1.5% increase Scenario 2: 4 per year (4 additional dry days); 1.5% increase Scenario 3: 3 per year (4 additional dry days); 1.0% increase
Hydrology • Worked with Vieux, contractors for City of Austin Flood Early Warning System (FEWS) • Translated outputs from RCM to hydro model inputs (key variables included heavy [99th percentile] rainfall events) • Adjusted impervious surface estimation based on development forecasts • Derived projected current and 2040 flood hazard areas, estimated depths, flow rates, and velocity at cross widths
Vulnerability Screening • Worked with FHWA Vulnerability Assessment Scoring Tool (VAST) • Based on climate outputs and sensitivity indicators conducted screening analyses for 9 critical assets, developed preliminary risk hypotheses • Convened agency focus groups to help validate and refine hypotheses
Sample Risk Analysis • Highest risk to flooding • Drought, heat, and wildfire moderate-high risk • Low sensitivity to heat
Preliminary Results 1 • Issue is less catastrophic, region-wide impacts (e.g., unlike some coastal communities) • Challenges more about situational, localized risks (e.g., flooding) AND regionwide 1) asset management issues (e.g., deterioration due to drought) and 2) emergency response (e.g. safe evacuation routes) • E.g., wildfire pinch points
Preliminary Results 2 • Flooding risk is case by case, impacts depend greatly on robustness of infrastructure, threat may be exacerbated by more intense extreme rainfall events, increasing urbanization • Heightened drought risk, relevant for assets situated on expansive clay soils • Decrease in soil moisture may worsen issues
Preliminary Results 3 • Soil moisture correlated with heighted WF risk, few direct impacts on infrastructure, but leads to disruptions, delays • Extreme temperature, almost certain to increase in frequency, but not of great concern • Icing events, although rare (expected to become rarer) cause regionwide disruptions
Preliminary Lessons Learned • Avoid the climate change debate • Focus on extreme weather vulnerability • Approach operating agencies with care • Growth, other non-climate stressors, can affect extreme weather impacts • Explain model uncertainty
Next Steps for CAMPO region • Incorporate the results into the 2040 Planning process • Summit of pilot partners, peer regions • Texas MPOs • Incorporate into City of Austin multi-sectoral plans • Proceed to adaptation and/or expand/refine risk picture
Thank you! Cathy Stephens CAMPO cathy.stephens@campotexas.org Josh DeFlorio Cambridge Systematics jdeflorio@camsys.com