Download
1 / 18
180 likes | 380 Views
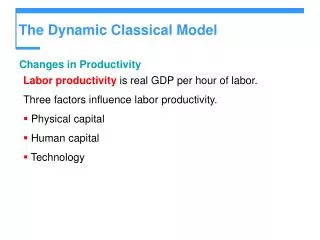
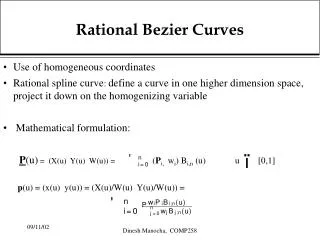
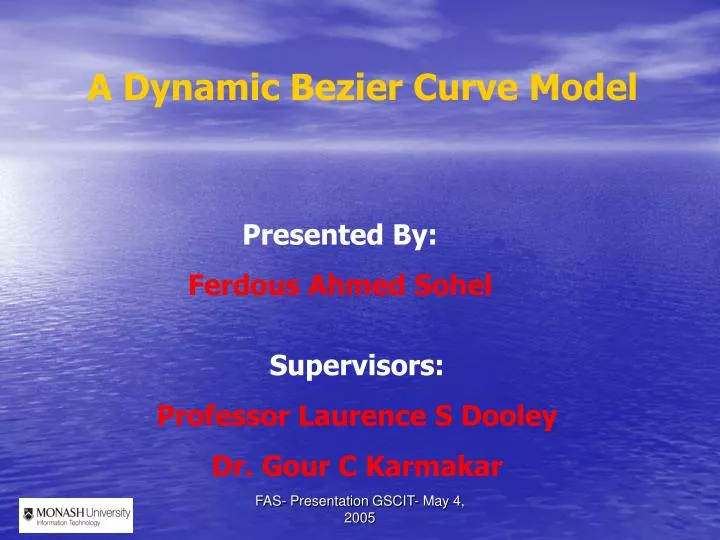
A Dynamic Bezier Curve Model. Presented By: Ferdous Ahmed Sohel. Supervisors: Professor Laurence S Dooley Dr. Gour C Karmakar. Presentation Outline. Introduction Research Motivation A Dynamic Bezier Curve Model Theory Experimental Results Conclusions. Introduction. Rate information.

E N D
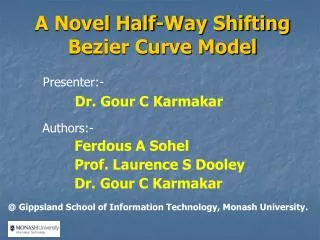
A Dynamic Bezier Curve Model Presented By: Ferdous Ahmed Sohel Supervisors: Professor Laurence S Dooley Dr. Gour C Karmakar FAS- Presentation GSCIT- May 4, 2005
Presentation Outline • Introduction • Research Motivation • A Dynamic Bezier Curve Model • Theory • Experimental Results • Conclusions FAS- Presentation GSCIT- May 4, 2005
Introduction Rate information Coder 0101010 … 000110 2. Bezier curve Distortion information 1. Applications Besides shape coding Bezier curves are used in many application like CAD, CAGD, PS font description. • Shape coding FAS- Presentation GSCIT- May 4, 2005
Research Framework Existing ORD Algorithms Original Shape Decoded Shape Curve/ Shape Any coding or customised chain coding: 4 Distortion Metric: 1 Evaluation: 6 Numerical Results Bezier and enhancements: 2 Scalable/ optimal shape coding frame-work: 5 Control point optimisation and degree genera-lisation: 3 Any other application FAS- Presentation GSCIT- May 4, 2005
Existing Techniques on Bezier • Degree Elevation 2. Composite Bezier All Increase the Number of Control Points 3. Refinements & Subdivisions FAS- Presentation GSCIT- May 4, 2005
Challenges of Existing Techniques • Complexity • Computation • Storage Complexity • Coding • 2. No trade-off in rate distortion • 3. Transmission cost • Higher bit rate FAS- Presentation GSCIT- May 4, 2005
Enhancements on Bezier Curve Only Global No Local Info. Why enhancements are required? FAS- Presentation GSCIT- May 4, 2005
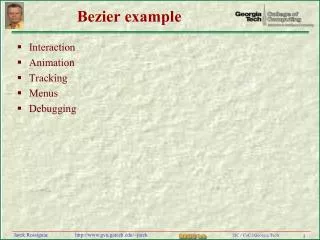
Examples with Local Information FAS- Presentation GSCIT- May 4, 2005
Proposed Enhancements • Enhanced Bezier Curve Models (EBC) • Half-way Shifting Bezier Curve Model (HBC) - Can reduce the gap to a certain level. 3. Dynamic Bezier Curve Model (DBC) DBC FAS- Presentation GSCIT- May 4, 2005
8 6 Control Polygon DBC-0.3 DBC-0.7 4 Bezier curve 4 6 8 10 12 Dynamic Bezier Curve • Shifts the Bezier Point in the region betn the curve and the control polygon. • The shifting parameter optimises the global vs. local effect of the control points. FAS- Presentation GSCIT- May 4, 2005
8 6 Control Polygon DBC-0.3 DBC-0.7 4 Bezier curve 4 6 8 10 12 DBC: Steps • Calculate the value of the shifting parameter • Determine the DBC point by shifting the Bezier point towards its closest point on the control polygon FAS- Presentation GSCIT- May 4, 2005
DBC: Features • Minimise the gap between the control polygon and the curve • Retain the core properties of Bezier curve • Computational complexity is same O(Degree) • All Bezier refinement techniques can be seamlessly integrated. FAS- Presentation GSCIT- May 4, 2005
DBC: Results Distortion Metrics: Class 1 distortion: Peak distortion (Dmax), unit - pel Class 2 distortion: Mean-Squared distortion (Doverall), unit - pel2. FAS- Presentation GSCIT- May 4, 2005
DBC: Results BC DBC Dadm=4 pel Dadm=2 pel Dadm=2 pel Dadm=1 pel FAS- Presentation GSCIT- May 4, 2005
DBC: Results Dadm=0.5 pel Dmax=1 pel FAS- Presentation GSCIT- May 4, 2005
DBC: Results FAS- Presentation GSCIT- May 4, 2005
DBC: Conclusions • Integrates local informationof the control points along with the Bezier global. • Minimises the gap between the control polygon and the curve. • Retains the core properties of Bezier. • Provides better shape representation than Bezier. • All Bezier refinements can be integrated. • Same computational complexity of Bezier. FAS- Presentation GSCIT- May 4, 2005
Thank You FAS- Presentation GSCIT- May 4, 2005