Download
1 / 16
160 likes | 311 Views
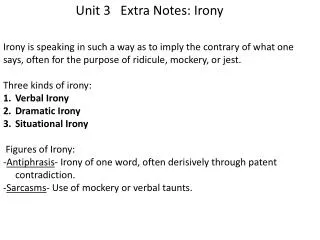
Extra Notes. Dr. Ahmad Syamil QM 2113 Business Statistics. Chapter 2 Mutually exclusive classes. Age: Less than 10 years 10 – less than 25 25 – less than 30 30 and over.

E N D
Extra Notes • Dr. Ahmad Syamil • QM 2113 Business Statistics
Chapter 2Mutually exclusive classes Age: • Less than 10 years • 10 – less than 25 • 25 – less than 30 • 30 and over
For any types of distribution (normal, uniform, binomial, exponential, Poisson, etc.):Standard deviation = SQRT (variance) Chapters 4 and 5
Chapter 4 • Elementary events: .e1=head .e2=tail Sample space: {e1,e2}
Chapter 4Probability Assessments • Classical (a priory) • Relative frequency • Subjective
Data/distribution/variable • Discrete ->counting process Chapter 5 Population, # of chairs 100,000; 5 chairs, etc. -> integer • Continuous Measurement process - Chapter 5 Height, weight, distance, etc. 1.25; 8.768; 12.876 ->fraction is OK
Chapter 5Discrete dist. • Uniform • Binomial • Poisson • Others
Chapter 6Continuous Dist. • Normal/bell curve/ z distribution • Uniform • Exponential • Others: • Student’s t distribution (Chapter 7) • Chi-square distribution (Chapter 8)
Chapter 5 2 Types of Normal Distribution Problems: • Given Z or calculate Z and then find P (=big “P” =percentage =probability =chance) • Given P, then find X, or You solve them using: and normal/z distribution
Poisson & Exponential Dist • Waiting line: Banks , McDonald, Wal-Mart: • Number of customers/hour discrete (Poisson/Chapter 5) • Mean time between customer -> continuous (Exponential/Chapter 5)
Chapter 6: Sampling Distribution • Mean • Proportion We solve them using Z (normal) distribution
Chapter 7 Summary • Point Estimate • x (sample mean) (population mean) • .p (sample proportion) (population proportion) • Confidence Interval • Population mean () • (population standard deviation) is given (known): Use z (standard normal distribution) • (pop std dev) is not given but s (sample std dev) is given Use student’s t distribution • Population proportion () Use z (standard normal distribution) Note: p = “small p” = sample proportion P = “big P” = probability = chance
Chapter 7 • SAMPLE PROPORTION • Where: • p = Sample proportion • x = Number of items in the sample having the attribute • n = sample size
Chapter 7CNN/Gallup Pool/USA Today • The margin of error is the sampling error if the level of confidence = 95% Bush = 51% [48%, 54%] Gore = 49% -> [46%, 52%] Margin of error = 3%
Chapter 7Student’s t distribution Degrees of freedom = sample size – number of parameters . df = n – k Chapter 7 -> k = 1 (always) Therefore, in Chapter 7, df = n -1
Chapter 13Summary: Simple Linear Regression AnalysisPage 528, Step 5 (a)t test for b1 (regression slope) = Fig. 13-18, page 528. (b).t test for (rho = coefficient of correlation) = Fig. 13-6, page 508. (c extra) F test for testing the overall regression model (equation) All of the 3 tests MUST produce the same conclusion.