Download
1 / 30
300 likes | 327 Views
Explore fundamental economic principles of demand, supply, and price in Chapters 4, 5, and 6. Learn about demand schedules, curves, determinants, and market equilibrium. Discover how factors like income, substitutes, complements, and trends influence consumer behavior. Dive into the basics laws of supply and demand, and comprehend how they shape pricing dynamics.

E N D
Supply, Demand, and Price Chapters 4, 5, & 6
Important Concepts we will Learn • Demand • Supply • Price • Demand Schedules • Demand Curve • Supply Curve • Supply Schedule • Market Equilibrium Price • Basic Law of Supply • Basic Law of Demand • Reasons for Shift • Relationship between Supply and Demand and how they determine Price
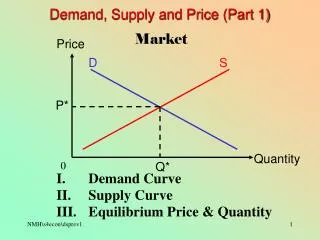
Introduction • A market is made up of consumers and suppliers • The market needs both to function • Suppliers determine supply • Consumers determine demand • Supply and demand determine price
Candy Sale! Students are selling candy as a fundraiser. They have a wide variety of options. How much would you be willing to pay?
Demand Demand refers to the consumer’s desire and willingness to pay a price for a specific good or service The basic law of demand is that if all other factors are constant, an increase in the price of a good or service will decrease demand A demand curve shows the relationship between the price of a certain commodity and the amount of it that consumers are willing and able to purchase at any given price
Determinants of Demand: Causes of change/shift 1. Change in income • Normal vs. inferior goods (inferior ex. Ramen, generic products) • When people make more money, they buy more. Unless its an inferior good then its reversed. You buy less when you make more. 2. Change in prices and availability of substitutes • Ex. if pens get more expensive, more people will buy pencils. If there was suddenly a shortage of coke you would buy more Pepsi. The price of pencils and Pepsi didn’t change but the amount demanded did. 3. Change in prices and availability of complements • If paper got more expensive, people would buy less paper AND less pencils • If jelly got more expensive, people couldn’t buy as much and therefore would also buy less peanut butter.
Determinants of Demand: Causes of change/shift 4. Change in weather or seasons • People buy less swimsuits in winter, more in summer. People buy more rock salt in winter, less in summer. • Price of gas goes up in summer because of increase of demand due to travel. 5. Change in numbers of buyers • Ex. larger/smaller market, population change, technology • When an android app gets approved for apple too then the size of market goes up 6. Change in styles, tastes, habits, preferences • Trends, how cool something is, fashion, etc. • Uggs used to be really trendy but now other styles of boots are more popular 7. Change in expectations • Future oriented decisions, ex. Harvest, technology • I’m not going to buy major electronics to replace mine if they aren’t broken at the beginning of November if they could go on black Friday sale.
Movement along the Demand Curve • In economics, the law of demand states that the quantity demanded and the price of a good or service is inversely related, other things remaining constant. Therefore, the demand curve will generally be downward sloping, indicating the negative relationship between the price of a good or service and the quantity demanded. • If the income of the consumer, prices of the related goods, and preferences of the consumer remain unchanged, then the change in quantity of good demanded by the consumer will be negatively correlated to the change in the price of the good or service. The change in price will be reflected as a move along the demand curve.
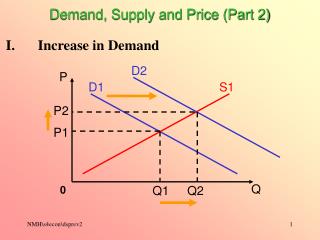
Shift in the Demand Curve The demand curve will shift, move either inward or outward as a result of non-price factors. • Change in income, prices/availability of complements/substitutes, seasonal change, number of buyers, personal preference/style/trends, change in expectations.
Demand Schedule and Demand Curve A market demand schedule is a table that lists the quantity of a good all consumers in a market will buy at every different price. A market demand schedule for a product indicates that there is an inverse relationship between price and quantity demanded. The graphical representation of a market demand schedule is called the market demand curve.
Demand Curve The demand curve is the graphical representation of the economic entity’s willingness to pay for a good or service. It is derived from a demand schedule, which is the table view of the price and quantity pairs that comprise the demand curve. Given that in most cases, as the price of a good increases, agents will likely decrease consumption and substitute away to another good or service, the demand curve embodies a negative price to quantity relationship. The curve typically slopes downward from left to right; though there are some goods and services that exhibit an upward sloping demand, these goods and services are characterized as abnormal.
Supply Supply is the quantity of a good or service that a producer is willing and able to supply onto the market at a given price in a given time period (the total amount available for purchase at that time) The basic law of supply is that as the price of a product rises, so businesses expand to supply the market A supply curve shows a relationship between market price and how much a supplier is willing and able to sell at that time
Determinants of Supply • Price- As the price of a firm's output increases, it becomes more attractive to produce that output and firms will want to supply more. Economists refer to the phenomenon that quantity supplied increases as price increases as the law of supply. • Input Prices- Inputs to production, or factors of production, are things like labor and capital, and all inputs to production come with their own prices. For example, a wage is a price of labor and an interest rate is a price of capital. When the prices of the inputs to production increase, it becomes less attractive to produce, and the quantity that firms are willing to supply decreases. In contrast, firms are willing to supply more output when the prices of the inputs to production decrease. • Technology- Increases in technology make it more attractive to produce (since technology increases decrease per unit production costs), so increases in technology increase the quantity supplied of a product. On the other hand, decreases in technology make it less attractive to produce (since technology decreases increase per-unit costs), so decreases in technology decrease the quantity supplied of a product. • Expectations- expectations about the future determinants of supply, meaning future prices, future input costs and future technology, often impact how much of a product a firm is willing to supply at present
Movement along the Supply Curve The law of supply states that all else being equal, the quantity supplied of an item increases as the price increases and vice versa. The “all else being equal” part is important here, since it means that input prices, technology, expectations, etc. are all held constant and only the price is changing. The vast majority of goods and services obey the law of supply, if for no other reason than it's more attractive to produce and sell an item when it can be sold at a higher price. Graphically, this means that the supply curve usually has a positive slope, i.e. slopes up and to the right. (Note that the supply curve doesn’t have to be a straight line, but, like the demand curve it’s usually drawn that way for simplicity.)
Supply Schedule and Supply Curve The market supply schedule is a table that lists the quantity supplied for a good or service that suppliers throughout the whole economy are willing and able to supply at all the possible prices.
Supply Curve The more they can sell the lattes for, the more they will want to supply, because then they can make more of a profit. But how will the rise in prices affect demand…?
Supply and Demand This is the basic supply and demand graph. The higher the price a supplier can sell a product or service for, the greater the quantity they are willing to supply. The lower the price a consumer can buy a product or service for, the more they are likely to buy. The point where the two lines meet is the Market Equilibrium Price.
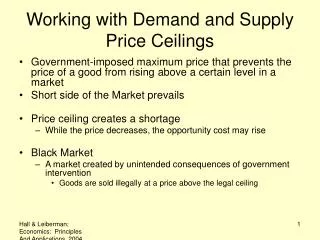
Price • If supply goes up, and demand stays constant, price will go down • Ex. Demand for gas stays the same but supply of gas goes up, gas price drops • If demand goes up, and supply remains constant, price will go up • Ex. Supply of ice cream remains the same, but summer starts so demand goes up, price will go up • If supply goes down, and demand remains constant, price will go up • Ex. After a natural disaster, supply of basic necessities goes down but people still need them as much as ever, price can skyrocket • If demand goes down, and supply remains constant, price will go down • January starts and new years resolutions to lose weight skyrocket, demand for junk food goes down, supply of junk food remains constant, price drops
Determining Price and Quantity Decide whether event shifts Supply Curve, Demand Curve, or both. Decide which direction the curve shifts. Use supply-demand graph to see how the shift changes the equilibrium price and quantity.
Try it out! Directions: Use this demand schedule to create a demand curve to go along with it on a piece of graph paper. Example: Candy Bar Fundraiser
Try it out! Directions: Add the new demand curve where it should go. Label the original line D1 and the new line D2. Example: Candy Bar Fundraiser Shift: It’s the week of Valentine’s Day and demand increases because people want to buy chocolate as gifts.