Download
1 / 10
100 likes | 222 Views
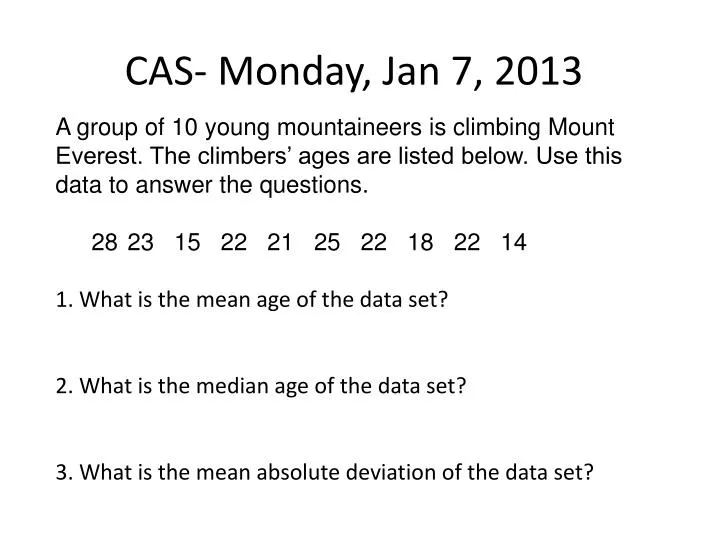
A group of 10 young mountaineers is climbing Mount Everest. The climbers’ ages are listed below. Use this data to answer the questions . 23 15 22 21 25 22 18 22 14 1. What is the mean age of the data set? 2. What is the median age of the data set?

E N D
A group of 10 young mountaineers is climbing Mount Everest. The climbers’ ages are listed below. Use this data to answer the questions. • 23 15 22 21 25 22 18 22 14 • 1. What is the mean age of the data set? • 2. What is the median age of the data set? • 3. What is the mean absolute deviation of the data set? CAS- Monday, Jan 7, 2013
CA- Monday, Jan 7, 2013 • The numbers of runs scored by a softball team in 20 games are given. • 3, 4, 8, 12, 7, 5, 4, 12, 3, 9, 11, 4, 14, 8, 2, 10, 3, 10, 9, 7 • Use the given data to make a box plot.
CAS- Tuesday, January 8, 2013 • A group of friends compares shoe sizes. Their shoe sizes are listed below. Use the data set to complete the problems that follow. 5 6 6 7 9 9 10 10 • What is the median of the data set? • What is the first quartile of the data set? • What is the third quartile of the data set? • Create a box plot of the data.
CA- Tuesday, January 8, 2013 77, 78, 90, 82, 52, 81,90 • What is the median of the data set? • What is the first quartile of the data set? • What is the third quartile of the data set? • Create a box plot of the data.
CAS- Wednesday, Jan 9, 2013 Elizabeth surveys 9th graders, 10th graders, and 11th graders in her school. She asks each student how many hours they spend doing homework each night. She records the responses in the table below. • How many 9th graders spend 0–2 hours on homework each night? • How many 10th graders spend 2–4 hours on homework each night? • Which response was the most popular among 11th graders? 0–2 hours, 2–4 hours, or more than 4 hours?
CA - Wednesday, Jan 9, 2013 • Find the Mean, Median, Mode, Range, IQR. 15, 16, 19, 21, 15, 14, 18, 16, 18, 20, 21, 22, 21, 20, 18, 17, 21, 20, 10
CAS Thursday, Jan 11, 2013 • Create a Box Plot and Dot plot from the following data 14, 13, 10, 9, 1, 14, 14, 13, 10, 1, 14, 13, 10, 9, 1, 12
CA Thursday, Jan 11, 2013 • Create a histogram who’s intervals are 50-60, 60-70, 80-90 with the following data. 54, 56, 58, 61, 62, 63, 64, 65, 68, 71, 77, 75, 81, 89
CAS Friday, Jan 11, 2013 Find the MAD for 14, 15, 12, 20, 25, 20, 11, 10, 12, 13
CA Friday, Jan 11, 2013 • Describe the following graphs • 1 2