Download
1 / 67

E N D
The process by which public schools identify students as learning disabled often appears to be confusing, unfair, and logically inconsistent. In fact, G. Reid Lyon of the National Institute of Child Health and Human Development has suggested that the field of learning disabilities is a sociological sponge whose purpose has been and is to clean up the spills of general education. (Gresham, 2001) “ ” Source: Gresham, F. M.. (2001). Responsiveness to intervention: An alternative approach to the identification of learning disabilities. Paper presented at the Learning Disabilities Summit, Washington DC.
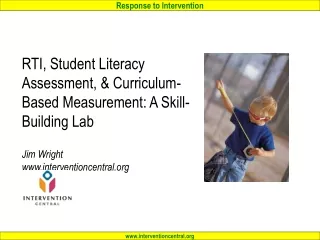
RTI Lab: Creating District Decision Rules for Analyzing RTI Data to Determine LD EligibilityJim Wrightwww.interventioncentral.org
Keynote PowerPoints and Related Resources Available at: • http://www.jimwrightonline.com/solvay.php
NYSED RTI Guidance Memo: April 2008 Source: DeLorenzo, J. P., & Stevens, J. C. (April 2008). Implementation of response to intervention programs. [Memorandum issued by New York State Education Department]. Retrieved November 25, 2008, from http://www.vesid.nysed.gov/specialed/publications/policy/RTI.htm
The Regents policy framework for RtI: • Authorizes the use of RtI in the State's criteria to determine learning disabilities (LD) and requires, effective July 1, 2012, that all school districts have an RtI program in place as part of the process to determine if a student in grades K-4 is a student with a learning disability in the area of reading. “Effective on or after July 1, 2012, a school district shall not use the severe discrepancy criteria to determine that a student in kindergarten through grade four has a learning disability in the area of reading.” [8 NYCRR section 200.4(j)] Source: DeLorenzo, J. P., & Stevens, J. C. (April 2008). Implementation of response to intervention programs. [Memorandum issued by New York State Education Department]. Retrieved November 25, 2008, from http://www.vesid.nysed.gov/specialed/publications/policy/RTI.htm
RTI Assumption: Struggling Students Are ‘Typical’ Until Proven Otherwise… RTI logic assumes that: • A student who begins to struggle in general education is typical, and that • It is general education’s responsibility to find the instructional strategies that will unlock the student’s learning potential Only when the student shows through well-documented interventions that he or she has ‘failed to respond to intervention’ does RTI begin to investigate the possibility that the student may have a learning disability or other special education condition.
Tier 3: Intensive interventions. Students who are ‘non-responders’ to Tiers 1 & 2 are referred to the RTI Team for more intensive interventions. Tier 3 Tier 2 Individualized interventions. Subset of students receive interventions targeting specific needs. Tier 2 Tier 1: Universal interventions. Available to all students in a classroom or school. Can consist of whole-group or individual strategies or supports. Tier 1 RTI ‘Pyramid of Interventions’
What previous approach to diagnosing Learning Disabilities does RTI replace? Prior to RTI, many states used a ‘Test-Score Discrepancy Model’ to identify Learning Disabilities. • A student with significant academic delays would be administered an battery of tests, including an intelligence test and academic achievement test(s). • If the student was found to have a substantial gap between a higher IQ score and lower achievement scores, a formula was used to determine if that gap was statistically significant and ‘severe’. • If the student had a ‘severe discrepancy’ [gap] between IQ and achievement, he or she would be diagnosed with a Learning Disability.
Avg Classroom Academic Performance Level Discrepancy 1: Skill Gap (Current Performance Level) Discrepancy 2: Gap in Rate of Learning (‘Slope of Improvement’) Target Student ‘Dual-Discrepancy’: RTI Model of Learning Disability(Fuchs 2003)
RTI Information: What It Does and Doesn’t Do • The primary purpose for the special education eligibility team to evaluate general-education RTI information is to rule out instructional explanations for the struggling student’s academic concerns. • RTI information does not in and of itself provide detailed information to allow schools to draw conclusions about a student’s possible neurological differences that make up the construct ‘learning disabilities’. • Therefore, RTI information allows for a rule-out (the learning problem resides within the student, not the classroom) but does not in and of itself provide positive evidence of a learning disability.
Team Activity: What Are Your Major Challenges in Using RTI Data to Help to Determine Special Education Eligibility? What are the major challenge(s) that your school or district faces as you make the transition to using RTI data to help to make special education eligibility decisions? Be prepared to report out on those challenges.
Student Academic Performance: How to Determine ‘Discrepancy’
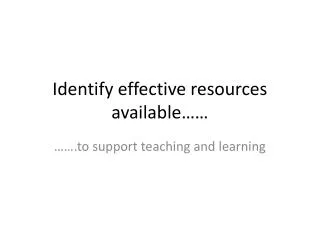
Learning Disabilities in the Age of RTI: Introduction • Analyzing Student Academic Risk: Performance Level and Rate of Improvement • Evaluating a Student’s ‘Non-Responder’ Status: A Comprehensive Checklist • Developing Your District’s Decision Rules for Using RTI Data to Determine ‘Non-Response’ Status: First Steps RTI Data & LD Determination: Agenda…
Evaluating a Student’s ‘Non-Responder’ Status: An RTI Checklist
CSE & RTI: Questions… • On what date will your CSE require RTI data for LD eligibility meetings? • What documentation of teacher (Tier 1) interventions will CSE expect? • If teacher (Tier 1) interventions alone are not successful, how many Tier 2/3 interventions will be required before a student can be referred to CSE? • For what disability categories will the CSE require RTI data to help in determining eligibility? • What is the minimum length of time that a Tier 2/3 intervention should last and how many data points should be collected to monitor progress?
CSE & RTI: Questions…(Cont.) • What is the minimum length of time that a Tier 2/3 intervention should last and how many data points should be collected to monitor progress?
Avg Classroom Academic Performance Level Discrepancy 1: Skill Gap (Current Performance Level) Discrepancy 2: Gap in Rate of Learning (‘Slope of Improvement’) Target Student ‘Dual-Discrepancy’: RTI Model of Learning Disability(Fuchs 2003)
Definition: Parallax “an apparent displacement or difference in the apparent position of an object viewed along two different lines of sight, and is measured by the angle or semi-angle of inclination between those two lines.” Source: Parallax. (2010, August 11). In Wikipedia, The Free Encyclopedia. Retrieved 09:33, August 13, 2010, from http://en.wikipedia.org/w/index.php?title=Parallax&oldid=378400891
Defining ‘Discrepant’ Academic Performance: Do We Use External Norms or Local Norms? External (Research or Benchmark) Norms: Used to answer such questions as: • Is the school’s core program successful (comparison of local to research norms)? • Is a child performing at a minimum level of competency in the skill? • What objective academic performance criteria determine student entry into and exit from Tier 2 and 3 intervention programs? Local Norms: Used to answer such questions as: • What is the typical range of student ability in the grade level or school? • How is a particular student performing relative to other children in the grade level or school?
Baylor Elementary School : Grade Norms: Correctly Read Words Per Min : Sample Size: 23 Students Group Norms: Correctly Read Words Per Min: Book 4-1: Raw Data 31 34 34 39 41 43 52 55 59 61 68 71 74 75 85 89 102 108 112 115 118 118 131 LOCAL NORMS EXAMPLE: Twenty-three 4th-grade students were administered oral reading fluency Curriculum-Based Measurement passages at the 4th-grade level in their school. • In their current number form, these data are not easy to interpret. • So the school converts them into a visual display—a box-plot —to show the distribution of scores and to convert the scores to percentile form. • When Billy, a struggling reader, is screened in CBM reading fluency, he shows a SIGNIFICANT skill gap when compared to his grade peers.
Median (2nd Quartile)=71 Group Norms: Converted to Box-Plot National Reading Norms: 112 CRW Per Min 1st Quartile=43 3rd Quartile=108 Source: Tindal, G., Hansbrouck, J., & Jones, C. (2005).Oral reading fluency: 90 years of measurement [Technical report #33]. Eugene, OR: University of Oregon. Billy=19 Hi Value=131 Low Value=31 0 20 40 60 80 100 120 140 160 Correctly Read Words-Book 4-1 Baylor Elementary School : Grade Norms: Correctly Read Words Per Min : Sample Size: 23 Students January Benchmarking Group Norms: Correctly Read Words Per Min: Book 4-1: Raw Data 31 34 34 39 41 43 52 55 59 61 68 71 74 75 85 89 102 108 112 115 118 118 131
Using Screening Results to Define ‘Discrepant’ Academic Performance Based on either external benchmarks or building-wide screening results, schools need to quantify the lower and upper range of academic performance that identifies a student as requiring Tier 2 supplemental intervention services. A student with screening results: • below the LOW cut-point is defined as having ‘severely discrepant’ academic skills when compared with these local norms and would benefit from Tier 3 intervention services. • between the LOW and HIGH values is at lesser academic risk and would benefit from Tier 2 intervention services. • above the HIGH value does not require supplemental interventions.
Using Screening Results to Define ‘Discrepant’ Academic Performance: Local vs. External Fluency Norms
Team Activity: What is the ‘Reachable, Teachable’ Range? • Assume that your school recently completed a gradewide screening for the 3rd grade using DIBELS Oral Reading Fluency probes and that the results were compiled into local norms. • What do you believe should be the percentile cut-off (5%?, 10?, 20%?) that your district might set that would demarcate the boundary between Tier 2 reading services (the student can be maintained with strong core instruction and supplemental RTI support) and Tier 3 (the student needs intensive support and may eventually be a candidate for a special education referral)?
Student ‘Rate of Improvement’ (Slope): How to Determine ‘Discrepancy’
Estimating Student Rate of Improvement: What Are the Relative Advantages of External vs. Local Growth Norms? • External (Research-Derived) Growth Norms: Provide a general estimate of the expected academic growth of a ‘typical’ student that can be applied across many academic settings. However, these norms may not be representative of student performance at a particular school. • Local Growth Norms: Provide an estimate of typical growth for students within a particular school’s population. This provides insight into current levels of student achievement and the effectiveness of instruction in that building. However, these results cannot easily be applied to other dissimilar academic settings.
Estimating Rates of Academic Growth/Slope Methods for estimating student academic growth can include: • Use of existing growth norms drawn from research Source: Shapiro, E. S. (2008). Best practices in setting progress-monitoring monitoring goals for academic skill improvement. In A. Thomas & J. Grimes (Eds.), Best practices in school psychology V (pp. 141-157). Bethesda, MD: National Association of School Psychologists.
Estimating Rates of Academic Growth/Slope Methods for estimating student academic growth can include: • Calculation of typical rates of student progress from EXTERNAL academic fluency norms (e.g., reading fluency norms from Hasbrouck & Tindal, 2005). Source: Hasbrouck, J., & Tindal, G. (2005). Oral reading fluency: 90 years of measurement. Eugene, OR: Behavioral Research & Teaching. Retrieved from http://www.brtprojects.org/tech_reports.php.
Estimating Rates of Academic Growth/Slope Using External Academic Fluency Norms Estimated student rate of improvement from research screening norms can be calculated by estimating the number of weeks separating each of the fall, winter, and spring screening periods (typically 16 weeks) and using the ordinary least squares method in Excel to compute the slope. • Example: Slope = 1.2 for these research norm screening data: • Gr2: Fall: 51 wcpm in school week 3 • Gr2: Fall: 72 wcpm in school week 19 • Gr2: Fall: 89 wcpm in school week 35 Source: Hasbrouck, J., & Tindal, G. (2005). Oral reading fluency: 90 years of measurement. Eugene, OR: Behavioral Research & Teaching. Retrieved from http://www.brtprojects.org/tech_reports.php.
Estimating Rates of Academic Growth/Slope Methods for estimating student academic growth can include: • Calculation of typical rates of student progress from LOCAL academic fluency norms (e.g., fall, winter, and spring oral reading fluency norms collected in a school). • All scores can be entered into Excel to generate individual student slopes (estimated rate of improvement) and mean/median slope for the group. Source: Hasbrouck, J., & Tindal, G. (2005). Oral reading fluency: 90 years of measurement. Eugene, OR: Behavioral Research & Teaching. Retrieved from http://www.brtprojects.org/tech_reports.php.
How Can a Student’s Rate of Improvement (Slope) Be Analyzed to See If It is ‘Discrepant’? There is not yet consensus in the research literature about how to set specific criteria to judge whether a student’s actual rate of academic progress is discrepant from expectations. Two possible methods to determine slope discrepancy are • direct comparison of the student slope to the local or external slope estimate—with a cut-off value to signal that the student is discrepant. • calculation of the standard deviation for the slopes of student’s in a local norming sample to determine whether a student falls at least one standard deviation below the mean slope of the group.
How Can a Student’s Rate of Improvement (Slope) Be Analyzed to See If It is ‘Discrepant’? (cont.) Direct Comparison With Research, Local Norms. The student slope can be divided by the local or external slope estimate—with a cut-off value (e.g., 0.75 or below) selected to indicate when this comparison value (quotient) is discrepant. NOTE: Any slope comparison quotient <1.0 indicates that the student did not meet growth expectations.