Download
1 / 13
130 likes | 303 Views
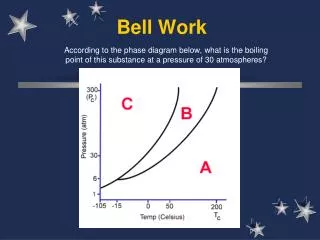
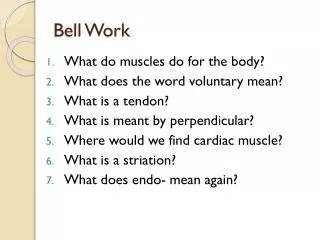
Bell Work. 2. Samuel has a bowl of fruit containing 3 apples, 2 oranges and 5 pears. If he randomly picks 1 piece of fruit from the bowl, what is the probability it will be a pear or an apple?. 1. What’s the probability that the spinner will land on blue?. Answers. 1. 2. 2. 3. 1. 4. 8.

E N D
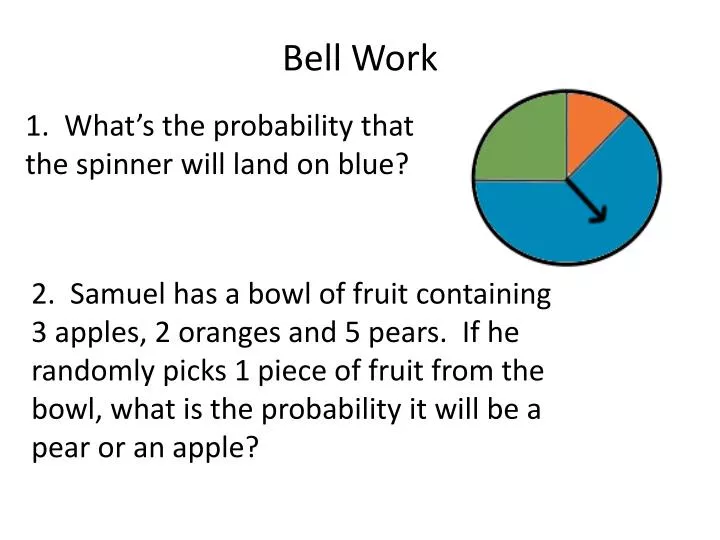
Bell Work 2. Samuel has a bowl of fruit containing 3 apples, 2 oranges and 5 pears. If he randomly picks 1 piece of fruit from the bowl, what is the probability it will be a pear or an apple? 1. What’s the probability that the spinner will land on blue?
Answers 1. 2. 2 3 1 4 8 5 7 6 3 apples oranges 2 + 5 pears 10 fruits total
Theoretical vs. Experimental Probability Theoretical Probability: - It is how a probability of an event “should” happen. Experimental Probability: - Experimental probability refers to the probability of an event occurring when an experiment was conducted.
There is a bag of blue, green and red chips. There is a 12% possibility of randomly picking a blue chip and a 25% chance of randomly picking a red chip. What is the probability of picking a green chip? Theoretical Probability Hint: Your three options are green, blue and red. Their probability will add up to 100% Answer: 63%
HEADS TAILS Experimental probability P(event) = number of times event occurs total number of trials You tossed a coin 10 times and recorded heads 3 times and tails 7 times P(head)= 3/10 , 0.3 or 30% A head shows up 3 times out of 10 trials, P(tail) = 7/10, 0.7 or 70% A tail shows up 7 times out of 10 trials
Comparing experimental and theoretical probability Both probabilities are ratios that compare the number of favorable outcomes to the total number of possible outcomes All results will add up to 100% every time! P(head)= 3/10 or 30% P(tail) = 7/10 or 70% P(head) = 1/2 or 50% P(tail) = 1/2 or 50%
Experimental Probability You draw a marble out of the bag, record the color, and replace the marble. After 5 draws, you record 2 red marbles. According to your experiment what is the probability of drawing each color? P(red)= 2/5, 0.4 or 40% P(blue)= 3/5, 0.6 or 60%
18 P(rolling a 6) = Number of favorable outcomes Total number of rolls 100 EXAMPLE 2 You roll a number cube 100 times. Your results are given in the table below. Find the experimental probability of rolling a 6. Write your answer as a percent. = 0.18 = 18% If you rolled the number cube 300 times then how many times would you predict that you would roll a 3 according to your experiment? 60 times
Results from rolling a six-sided die: • What is the experimental probability of rolling a 5? How does that compare to the theoretical probability? Experimental: P(rolling a 5) = 3/60 = 1/20 Theoretical: P(rolling a 5) = 1/6
Experimental Probability Example A class group flipped a coin and recorded their results below. What is their experimental probability of landing on heads? Solution The group landed on heads 6 times, so the experimental probability is:
Using the spinner below, what is the sample space? What is the probability that the spinner will land on “B” as a percentage? A,B,C,D,E A B E C 1/5 = 20% D