Download
1 / 13
130 likes | 279 Views
WORKSHOP ON AGRICULTURAL INVENTORIES AND PROJECTIONS EEA, COPENHAGEN 27-28 FEBRUARY 2003. SPANISH INVENTORY - AGRICULTURAL SECTOR: CHARACTERIZATION AND ANALYSIS OF MOST SIGNIFICANT PARAMETERS. Antonio Ferreiro 1 and Juan José Rincón Technical Assistance Team for Emission Inventories

E N D
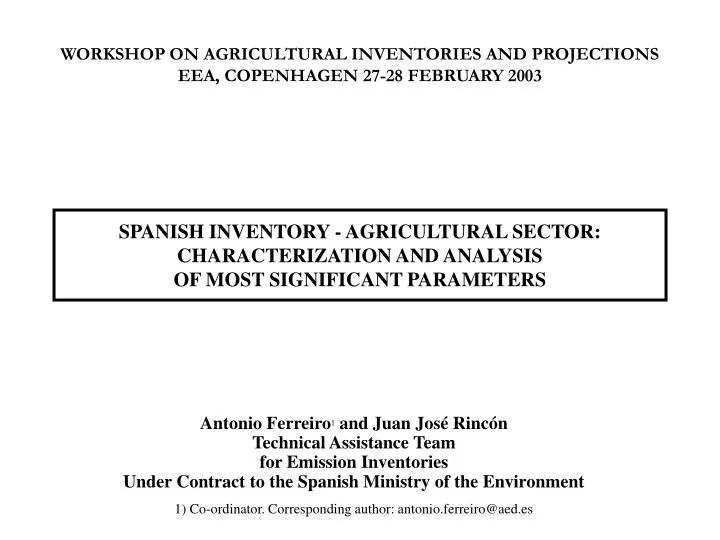
WORKSHOP ON AGRICULTURAL INVENTORIES AND PROJECTIONS EEA, COPENHAGEN 27-28 FEBRUARY 2003 SPANISH INVENTORY - AGRICULTURAL SECTOR: CHARACTERIZATION AND ANALYSISOF MOST SIGNIFICANT PARAMETERS Antonio Ferreiro1 and Juan José Rincón Technical Assistance Team for Emission Inventories Under Contract to the Spanish Ministry of the Environment 1) Co-ordinator. Corresponding author: antonio.ferreiro@aed.es
TABLE 8 PATHS OF N INPUTS TO SOILS AND N2O EMISSION WAYS(Figures in tonnes of N) N incorporated to soils 2.159.878 N2O-N direct from animal production N2O-N direct N2O-N indirect 1.465.755 68% 337.821 16% 356.302 16% FSN FAW FBN FCR AD L-R 5% 5% 16% 999.241 46% 15% 2% 108.967 44.630 312.917 356.302 294.288 N in manure applied to soils (no pasture) N in compost and sludge N from pasture lands N excreted by pasture animals N in manure applied to soils(1) Inorganic fertilizers N fixed by pulse N in crop residues Inorganic fertilizers kg inorganic fertilizers Number of animals N excreted AWMS Number of animals N excreted AWMS Number of animals N excreted AWMS kg inorganic fertilizers kg compost produced Ha yields Ha yields Ha (1): Plus N in compost and sludge.
TABLE 10 METHODOLOGY FOR THE CALCULATION OF THE NITROGEN EXTRACTION BY THE CROPS (B.N.A.E.)(1) PROVINCIAL PRODUCTIONS PROVINCIAL YIELDS (t/ha) MINIMUM AND MAXIMUM EXTRACTION (kg/t) MINIMUM AND MAXIMUM YIELD (t/ha) FOR EACH CROP NITROGEN EXTRACTION COEFFICIENTS FOR EACH CROP AND PROVINCE (kg/t) EXTRACTED NITROGEN DISTRIBUTION CROP/REST (Plant;stubble and roots) CROP (fruit) / REST (Leaves; Wood; Roots) EXTRACTED N DESTINATION (Retired, Pastured, Burned or Residual) TOTAL NITROGEN EXTRACTION FOR EACH CROP AND PROVINCE FRACTIONS OF RETIRED NITROGEN AND RESIDUE % RETIRED CROP % PASTURE % BURNING % RESIDUE RETIRED N / PASTURED N / BURNING N / RESIDUAL N (crop, crops group and total) (1): MAPA-WG on GHG&NB.