Download
1 / 16
160 likes | 378 Views
Adiabatic processes on a thermodynamic chart. Atms Sc 4310 / 7310 Lab 2 Anthony R. Lupo. Adiabatic processes on a thermodynamic chart. 1st law of thermodynamics in the form (imperfect form) is a statement of the Conservation of energy (heat in = heat out)!.

E N D
Adiabatic processes on a thermodynamic chart. Atms Sc 4310 / 7310 Lab 2 Anthony R. Lupo
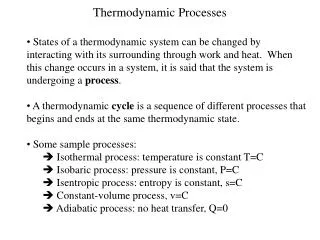
Adiabatic processes on a thermodynamic chart. • 1st law of thermodynamics in the form (imperfect form) • is a statement of the Conservation of energy (heat in = heat out)!
Adiabatic processes on a thermodynamic chart. • Left hand side (represents?): • Diabatic heating, which includes Latent Heat Release, Sensible Heating, and Radiational Heating.
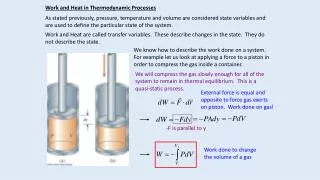
Adiabatic processes on a thermodynamic chart. • Right hand side: • Term 1: Internal Energy (due to Temperature) • Term 2: “pressure work” term or work done by pressure by the environment on a parcel. • (expansion – heat added to system diabatically • contraction - heat removed diabatically)
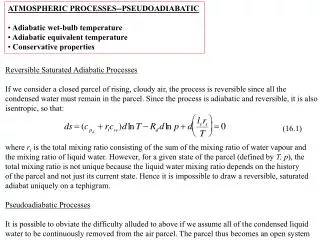
Adiabatic processes on a thermodynamic chart. • Adiabatic process • dq/dt = 0 (no work done)!! • Thus, the internal energy equals the pressure work term. Also, now there are no diabatics so;
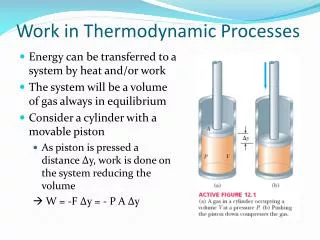
Adiabatic processes on a thermodynamic chart. • Expansion (lower pressure) cooling work done on air parcel and energy lost to environment • Contraction (higher pressure) warming work done by environment and energy gained at expense of environment
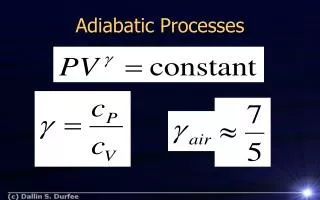
Adiabatic processes on a thermodynamic chart. • Constant Potential Temperature Adiabatic system or flow follows lines of potential temperature. • Why? Let’s derive relationship for potential temperature
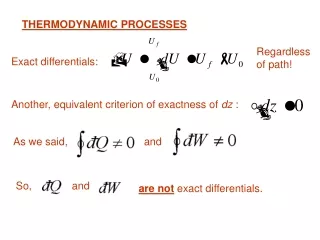
Adiabatic processes on a thermodynamic chart. • Derive…..start with 1st law
Adiabatic processes on a thermodynamic chart. • Some adiabatic processes • Adiabatic motion on the thermodynamic diagram: no work done, potential temperature is constant. • Use adiabatic motion as a first estimate of maximum temperature
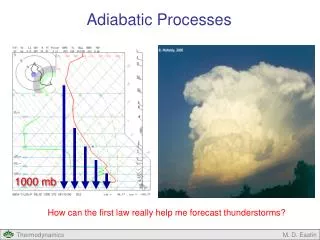
Adiabatic processes on a thermodynamic chart. • LCL – lifting condensation level (air lifted adiabatically until saturation!) • LFC – level of free convection: rising parcel becomes warmer than environment, rises under it’s own power, or due to bouyant forces. • CCL – convective condensation level: Raise parcel along. Environmental sounding until saturation (intersect mixrat. And sounding)
Adiabatic processes on a thermodynamic chart. • Convective temperature -- take parcel down dry adiabatically to surface, that’s the temp we must get to to get convection. • Equilibruim level – where parcel becomes neutrally bouyant again.
Adiabatic processes on a thermodynamic chart. Convective available potential energy: • + value: parcels warmer than environment which gains energy from the air parcels • - value: parcels cooler than environment which must do work to lift parcels and loses energy.
Adiabatic processes on a thermodynamic chart. • Other buoyancy related indicies: • Lifted Index • Showalter Index • Energy Index
Adiabatic processes on a thermodynamic chart. • Questions? • Comments? • Criticisms?