1 / 2

Bacterial Growth Analysis in Figure S1

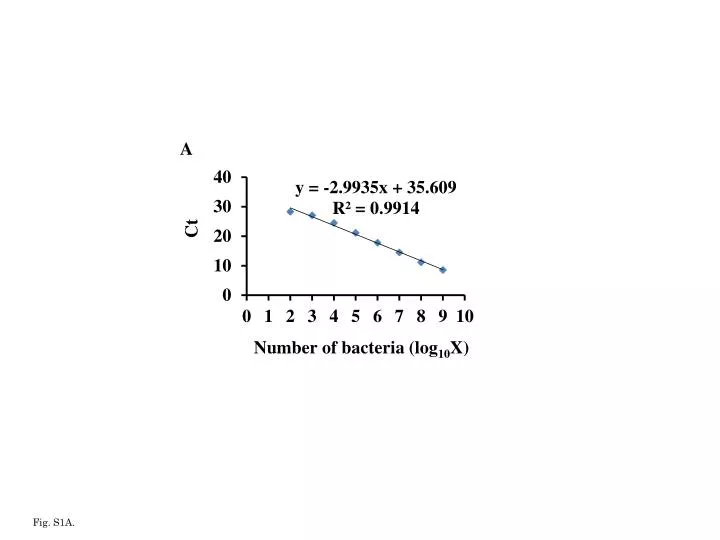
The figure displays log10X values for bacterial numbers at different time points, aiding in the analysis of bacterial growth patterns.

Download Presentation

Bacterial Growth Analysis in Figure S1

An Image/Link below is provided (as is) to download presentation Download Policy: Content on the Website is provided to you AS IS for your information and personal use and may not be sold / licensed / shared on other websites without getting consent from its author. Content is provided to you AS IS for your information and personal use only. Download presentation by click this link. While downloading, if for some reason you are not able to download a presentation, the publisher may have deleted the file from their server. During download, if you can't get a presentation, the file might be deleted by the publisher.

E N D

Presentation Transcript


  1. A Ct Number of bacteria (log10X) Fig. S1A.

  2. B Ct Number of bacteria (log10X) Fig. S1B.

More Related