Download
1 / 2
20 likes | 249 Views
Legend. 1. FOLFIRI Non-responder (8) 2. FOLFIRI Responder (10). Crea et al. Suppl. Fig. 1: list of PcG targets down-regulated in FOLFIRI non-responder vs. responder patients.

E N D
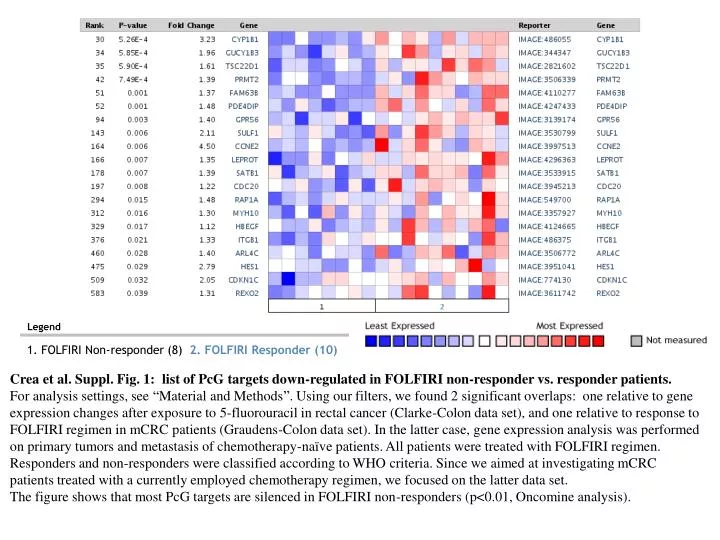
Legend 1. FOLFIRI Non-responder (8) 2. FOLFIRI Responder (10) Crea et al. Suppl. Fig. 1: list of PcG targets down-regulated in FOLFIRI non-responder vs. responder patients. For analysis settings, see “Material and Methods”. Using our filters, we found 2 significant overlaps: one relative to gene expression changes after exposure to 5-fluorouracil in rectal cancer (Clarke-Colon data set), and one relative to response to FOLFIRI regimen in mCRC patients (Graudens-Colon data set). In the latter case, gene expression analysis was performed on primary tumors and metastasis of chemotherapy-naïve patients. All patients were treated with FOLFIRI regimen. Responders and non-responders were classified according to WHO criteria. Since we aimed at investigating mCRC patients treated with a currently employed chemotherapy regimen, we focused on the latter data set. The figure shows that most PcG targets are silenced in FOLFIRI non-responders (p<0.01, Oncomine analysis).
T ALLELE: TTTGTTATTTTCTCTTTTTTGAAATATGCTTC XBP1 BINDING C ALLELE: TTTGTTATTTTCTCTTTTTTGAAATACGCTTC NO XBP1 BINDING Crea et al. Suppl. Fig. 2: Characterization of TF binding sites affected by rs3757441 SNP. Prediction on XBP binding are performed through PROMO3.0 software, as described in “Materials and Methods”. In red, XBP consensus sequence.