Download
1 / 53
530 likes | 547 Views
This presentation discusses the verification techniques and latest changes to ESD simulator requirements, along with practical aspects of measurement setup and conflicts between specifications. It also provides recommendations for air-discharge verification.

E N D
Background • Greg Senko, President Teseq Inc. – North American division of Teseq • Laboratory Technical Manager – Edison NJ • This presentation was first given in 2003 when lab was Schaffner • Co-authored with Ken Wyatt, Lab Manager Agilent Technologies • Teseq first ISO 17025 accredited by A2LA March 2006. • Audited for re-accreditation in 2008 and 2010. • Teseq scope of accreditation now includes IEC 61000-4-2: 2008-12 as well as many other industry standards: EN 61000-4-2, IEC 801-2, ISO TR 10605, ISO 10605, SAE J1113 -13, ANSI C63.16, FORD ES-XW7T-1A278-AC, GMW 3097, DC-10614, DC-11224 • Presentation includes these updates and experiences
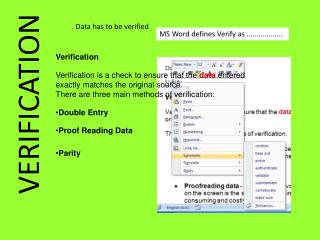
Outline Virtually every EMC laboratory has one or more ESD simulator. Many are equipped to verify the ESD simulators’ performance but few to the latest requirements. Topics: • Verification techniques, including ISO, SAE, ANSI and IEC standards • Latest changes to verification requirements • How the new systems compare to older systems • Practical aspects of measurement setup and performance • Conflicts between specifications • Recommendation for air-discharge verification
ESD Simulator Verification What parameters must be measured? Tip voltage – continuous, not discharge Current waveform – contact discharge • Peak • Rise time • Current at 30ns (for IEC network) • Current at 60ns (for IEC network) Current waveform – air discharge (automotive only) • Rise time • Time Constant
ESD Simulator Verification Measuring tip voltage Measured at standard test levels: ±2kV, ±4kV, ±6kV, ±8kV, ±15kV and ±25kV • Measured using Electrometer or Giga-ohm meter • Most standards don’t specify requirements • ISO 10605 specifies 100GOhm minimum input impedance • The simulator’s tip voltage not affected by the measurement • If a Giga-ohm meter is used, the simulator must continuously charge the high-voltage capacitor
ESD Simulator Verification Tip voltage measurement using Giga-ohm meter
ESD Simulator Verification Idealized ESD simulator waveform
ESD Simulator Verification Actual waveform measurement
TARGET CABLE OSCILLOSCOPE ATTENUATOR ATTENUATOR GROUND PLANE Measurement System How do we measure the current waveform? A low impedance shunt is used to represent a discharge into a large metallic object The shunt impedance is < 2.1 Ohms Block diagram:
Measurement Target IEC 61000-4-2 target Found where older standard editions are referenced • Axial resistors • Difficult to precisely control dimensions, center can shift • Poor impedance control
Measurement System Typical ESD current measurement system with Faraday cage – example from IEC 61000-4-2
Measurement System Typical ESD current measurement system – actual system used in some Teseq labs
ESD Simulator Verification Waveforms of IEC 801-2 target vs. ANSI target IEC 801-2 target ANSI target – Less HF ringing and shows true peak shape
Attenuators Choosing attenuators • Target transfer function is ~1V/A when loaded by 50 Ohms • Contact mode peak current at 8kV is ~30A • Input range of most oscilloscopes is < 10V in 50 Ohm mode • Attenuator is needed to reduce the signal level • 20dB is typically chosen for 10:1 ratio • Contact mode to 25kV may require additional attenuation
Attenuators Choosing attenuators • Low power attenuators may damaged by the short term peak power • Attenuators are available with 1kW peak power ratings • Use an 18GHz attenuator with low SWR, < 1.25 to 8GHz • The attenuator accuracy requires that the entire chain be calibrated • Accuracy variation dB Percentage 0.1 1.16% 0.3 3.51% 0.5 5.93% 0.7 8.39% 0.9 10.92%
Cables Choosing cables • A low loss cable is required • Cable length < 1m is required by most standards • Double shielding is required by most standards • The ANSI standard recommends RG 400 • RG 214 is twice the diameter, 1/2 the loss and is commonly available
Bandwidth Oscilloscopes - bandwidth The BW/risetime of the oscilloscope is the single most limiting factor to accurately measure the pulse risetime. The true risetime is related to the observed risetime as follows: The above correction is proposed in the ANSI draft standard and assumes a Gaussian rolloff in frequency response. However most digitizers use a sharper cutoff filter, 20dB/decade or higher.
ESD Simulator Verification Oscilloscopes - bandwidth How does bandwidth affect observed risetime? Let‘s assume a Gaussian rolloff
ESD Simulator Verification Oscilloscopes – sampling rate Single-shot sampling rate is the key • Sharp/traingular peak requires fast sample rate • Risetime of 800ps from 10%-90% is 80% of waveform • 10Gs/s = 100ps/sample • 8 samples in 800ps or 10%/sample! • Since peak is symmetrical and somewhat rounded actual error is < 5% Effective sampling rate increased by capturing multiple shots • Must have stable waveform • Contact mode only - never for air discharge • Shot to shot variation is low for most simulators • Should be used for verification - not for calibration
ESD Simulator Verification Shot to shot variation – 20 shots 33.3A peak Std dev .425 ±0.64% of peak 898ps Rise Std dev 11.9 ±0.66% of risetime
10 Gs/s - 32.23A -2.9% 2 Gs/s - 27.87A -16.0% 5 Gs/s - 31.92A -3.8% Sampling Rate Oscilloscopes – sampling rate SAE and ISO recommend 4Gs/s minimum 20 Gs/s 33.18A
Interpolation / Vectors Oscilloscopes – interpolation ON or OFF? Interpolation ON Interpolation OFF
ESD Simulator Verification Other factors – Dos and don’ts Shielding • Do we need it? Position of ground cable • Will it affect waveform? Orientation of simulator • Will it affect waveform? Automatic Measurements • Must use Min and Max values to calculate 10% and 90% points Other cables • Keep them well separated
Faraday Cage? Oscilloscope shielding – do we need it? Standards say yes, but probably not necessary - use distance test Scope inside chamber Scope at corner of plane Scope next to simulator
Measurement System Working ESD current measurement system without Faraday cage
Ground Cable Ground cable position Does affect results – peak, rise and duration Natural loop Loop closer to plane 20 Gs/s - 33.6A, 891ps 20 Gs/s - 36.9A, 926ps
Simulator Orientation Simulator orientation to target Does affect results – peak, rise and duration 20 Gs/s - 33.6A, 891ps 20 Gs/s - 33.6A, 913ps 20 Gs/s - 34.5A, 945ps Simulator on axis Simulator up 10° Up 30°
Air Discharge Waveform Air discharge – What risetime/peak do you want? Approach speed and environmental factors will greatly affect results - not repeatable Obtaining a passing waveform is a matter of patience!
ESD Simulator Verification Measurement uncertainty The estimated bounds of the deviation of a measured quantity from its true value • List all the possible error sources and compute the uncertainty • Uncertainty budget for each measured parameter • Statement of confidence that can be placed in the value of uncertainty • Does measured result truly fall within acceptable limits? National Association for Measurement and Sampling publication NIS81, The Treatment of Uncertainty in EMC Measurements Extensive reference information with examples in IEC 61000-4-2: 2008 Appendix E
The New IEC -4-2 Changes to Simulator Verification in IEC 61000-4-2: 2008 • Method for measuring low frequency system transfer impedance • Improved measurement target with RF specifications to 4GHz • Target calibration adapter defined • Minimum 2GHz oscilloscope bandwidth • Faraday cage may not be required • Peak current tolerance relaxed from ±10% to ±15% • Minimum rise time reduced from 700ps to 600ps • Ground cable position defined • Uncertainty calculation examples in Appendix E
Target Evolution Target design history IEC 801-2: 1991 • No longer referenced by any current standard • No performance specifications • Poor design - lots of ringing • Small ground plane IEC 61000-4-2: 1995, 2001 • Referenced by virtually all current standards • No performance specifications • Transfer function “zero” at 5-6 GHz IEC 61000-4-2: 2008-12 • New design with flatness specified to 4GHz • ≥ 2GHz Oscilloscope required • Adapter to evaluate high frequency performance
A Better Target IEC 61000-4-2: 2008 Target (example) • SMD resistors • Tighter tolerances • Better impedance control
Commercial Target System New target with adapter to measure transfer characteristics Calibration Adapter Measurement Target Tool for removing center
CURRENT SOURCE TARGET CABLE OSCILLOSCOPE ATTENUATOR ATTENUATOR GROUND PLANE Target Calibration Calibrating the target-attenuator-scope chain It is recommended that the DC transfer function of the entire chain be measured as follows: • Inject a known current • Measure the resulting voltage at the oscilloscope • The attenuation factor = Injected current / Observed Voltage • Attenuation factor is used to correct waveform amplitude
Target Calibration IEC 61000-4-2 target and adapter specifications Variation of attenuation of the adapter-target-attenuator-cable chain < ±0.5dB from DC to 1GHz (< ±5.9%) < ±1.2dB from 1GHz to 4GHz (< ±14.8%) Adapters must be tested too! • Return loss of two adapters face-to-face >30dB from DC to 1GHz > 20dB from 1GHz to 4GHz • Insertion loss of two adapters face-to-face < 0.3dB up to 4 GHz
Ground Cable Orientation IEC 61000-4-2: 2008 and ISO 10605: 2008
Scope Bandwidth Effects Oscilloscope 1GHz vs. 2.5GHz oscilloscope TDS 7104, 1GHz, 10GS/s Peak I – 29.02A Rise – 827ps I30 – 16.8A I60 – 8.8A Sample rate - 40ps/s TDS 7254, 2.5GHz, 20GS/s Peak I – 28.17A Rise – 803ps I30 – 16.5A I60 – 8.3A Sample rate – 10ps/s
The New 10605 Changes to Simulator Verification in ISO 10605: 2008 • New RC networks added to existing 150pF / 2kΩ, 330pF / 2kΩ • 150pF/ 330Ω– same specs as IEC 61000-4-2 • 330pF/ 330Ω– DC 10614 • New networks have IEC-like limits ±10% peak vs. +30/-0% • No air discharge verification – variability too high • Voltage • Approach speed • Humidity • Arc length • Ionization
Comparing Standards New 330/330 network – No issues
Comparing Standards Certificate to IEC -4-2 does not fulfill ISO 10605
Comparing Standards 10605: 2008 Cert. does not fulfill Ford and GM, use 2001 ed.
That Pesky Air-Discharge! Requirements from ISO 10605: 2001 • Only single events are allowed • Start at least 15mm away from the target • Approach slowly, 5mm/s or less • Levels are 4, 8 and 15kV both polarities • Rise time must be less than 5ns • Acceptable waveforms must be repeatable at least 6 of 10 attempts • Time constant is 300ns ± 60ns for 150pF network • Time constant is 660ns ± 130ns for 150pF network • Target from IEC 61000-4-2: 1995 referenced, no target plane req’s
That Pesky Air-Discharge! Series of 20 Discharges, 12 of 20 <5ns
That Pesky Air-Discharge! Series of 20 Discharges, Event #1
Do you Remember this Measurement Target? ISO 10605: 1994 Target from IEC 801-2 with Ball Tip
Balls of Steel Spherical center exchanged for flat center
Spherical Center How do we know the HF characteristic is OK? Standard Center Rise – 817ps Peak – 27.9A Spherical Center Rise – 822ps, +5ps, reproducibility 14ps Peak – 28.0A, +0.1, reproducibility 0.24A
That Pesky Air-Discharge! Summary • Some checks should be applied • There will be a high degree of variability shot-to-shot • Internal contact discharge relays increase variability • Environmental characteristics pay a big role • Contact shape affects discharge waveform • Flat targets perform worse than spherical centers • Spherical center does not alter target characteristics
Multiples Are they really there? • Very hard to capture • A second and sometimes a third discharge occurs • Typically >100ms between discharges • Fast sampling rate required to catch event, >1Gs/s • Long record length required – For 500ms, 500Mb! • Peak detect sampling mode works well