Download
1 / 20
200 likes | 209 Views
Recollection of the V plot story + few news from the task progress. 2008. Preliminary remarks. Quite old(ish) story – started from a non-formal meeting with Hans Drevermann in 2005 DALI - memorable display package heritage

E N D
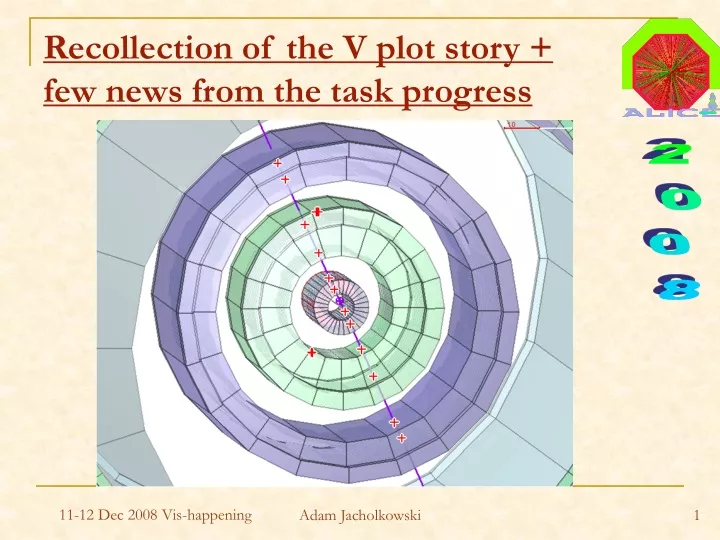
Recollection of the V plot story +few news from the task progress 2008 Adam Jacholkowski
Preliminary remarks • Quite old(ish) story – started from a non-formal meeting with Hans Drevermann in 2005 • DALI - memorable display package heritage • V PLOT’s main goal – to code 3D information into a 2D plot (more human friendly one) • A price to pay – need of a “key” in order to interpret the V plot • Few (my) historical slides (April 2005 !) first Adam Jacholkowski
Beginning of (few) historical slides First Physics Meeting (alias p p) April 2005
z INVENTING PERTINENT DIAGNOSTIC TOOLS – a huge task given complexity of ALICE Looking for global ways of data projections as checks of alignment and tracking , talk by Hans Drevermann from ALEPH/ATLAS (23 March 2005) http://ipt.web.cern.ch/IPT/PINS/DALI.html ρ Adam Jacholkowski
DALI: The Aleph Offline Event Display DALI was written and is maintained by H.Drevermann • DALI is an event display program based predominantly on special linear and non linear projections of the radial and cylindrical structure of the detector and the event. Special 3D methods are employed that do not rely on conventional 3D smooth rotations. DALI avoids wire frames and minimizes the concept of data reduction to simplify the image. Concepts from cognitive psychology are employed to optimize projections and coloring. • Brief description • Papers about event displays: Event Display: Can We See What We Want to See?Is there a future for Event Display? • Pictures of Aleph events: The DALI picture database (+cset) contains more than 1000 pictures, all in gif and in ps format. Annotated examples of different kinds of Z decay. A selection of the first events observed in Aleph at 130 GeV, 140 GeV, 161 GeV, 172 GeV, 183 GeV, 189 GeV, 19x GeV and 200 GeV Adam Jacholkowski webmaster@alephwww.cern.ch, 23rd July 1999
The Feynman – Tuft’s Principle:A visual display of data should be simpleenough to fit on the side of a van • Edward R. Tuft (the da Vinci of data) • Information displays should be • documentary • comparative • causal and explanatory • quantified • multivariate • exploratory • skeptical Adam Jacholkowski
SPIRAL READER – automatic finding and measurement of the BC tracks European Spiral Reader Symposium Stockholm, May 30 – June 1, 1972 The constituent digitizings for the candidates ..are found by mean of a routine in machine language and a linear fit of the equation: is tried on them by a least squares method Adam Jacholkowski
UNIVERSAL PLOT(p alias R known) Perfect circles Zero impacts -ve +ve global view of tracks quality Adam Jacholkowski
RHO-PHI slice zoom ρ [cm] fairly straight tracks φ[rad] Adam Jacholkowski
INVERSE GEOMETRYTRANSFORMATION (Conformal mapping) some sensitivity to the impact parameter Adam Jacholkowski
PHI SLICE in INVERSE GEOMETRY Yinv first layer last layer Xinv Adam Jacholkowski
V (not V0 !) track representation φ[rad] η – pseudo-rapidity k - a constant D - | ρ - ρmax | track diagnostics (simple design, intense content) η +- kD Adam Jacholkowski
An (artificial pileup) high multiplicity ALEPH event 221 tracks Adam Jacholkowski
End of historical slides New look at the V plot +implementation
Practical implementation problems and ad hoc solutions • AliTrackPointArray of TPC tracks extracted from AliESDfriend: • N of points does not correspond always to the content (corrupted points ?) • Use only good tracks (N of points > 50) to start • Phi continuation across the “boundary” (+π,-π) • Main vertex placedat (0,0,0) for simplicity, particles generated (genbox) in pseudorapidity range (-2,+2) • Constant k in η+-kD fixed to 0.0004, ηextractedfromparticle (true) momentum at the main vertex Adam Jacholkowski
Example 1 – limited momentum range Colored lines – joining badly assigned clusters Adam Jacholkowski ±kD
Example 2 – mixture of momenta Adam Jacholkowski ±kD
Some keys to “read” the plots • Missing apex – track ends before reaching ρ-max • Angle of V (or phi range spanned) – measure of momentum • V or Λdepending on particlesign • Distorted lines – track not coming from the primary vertex • Some extra (color) lines – strange clusters attached to a track: bad reconstruction or errors in AliTrackPointArray (some big jumps in phi already removed !) Adam Jacholkowski
Conclusion The prototype works, on can start to think about implementation of the V plot within AliEve THAT is ALL for NOW – THANKS !
ALICE coordinates Adam Jacholkowski